
The 2011 real estate market in Prosper, Texas showed an increase in activity and intriguing market dynamics compared to the prior year. With 279 single-family homes sold, representing a 21% jump in sales volume, the market offered varied opportunities for buyers and sellers. This analysis explores key data points, trends, and the implications of market shifts to give you a clearer picture of what 2011 brought to Prosper’s housing sector.
Key Takeaways and Trends from the 2011 Real Estate Market in Prosper, TX
1. Pricing Range
Home prices ranged significantly, from $98,000 to $1,499,000, which highlighted an increase in luxury home activity compared to the previous year. This showed not only diversity in the Prosper, TX housing market but also an inclination towards higher-end properties.
2. Market Efficiency
The average close price to listing price ratio of 95.58% indicated strong buyer interest, although slightly less efficient than the prior year. Median DOM at 72 days remained in line with a generally healthy market turnover.
3. Unique Outliers
The most expensive property of the year sold for nearly $1.5 million, boasting custom luxury features like expansive square footage, a prime lot, and opulent design elements that positioned it far above the market average.
4. Mortgage Rates Impact
With the average 30-year fixed mortgage rate ticking down to 4.65%, buyers likely found slightly greater affordability. However, increases in gas prices and other economic factors might have tempered some of the positive impact of lower mortgage rates.
Total Homes Closed
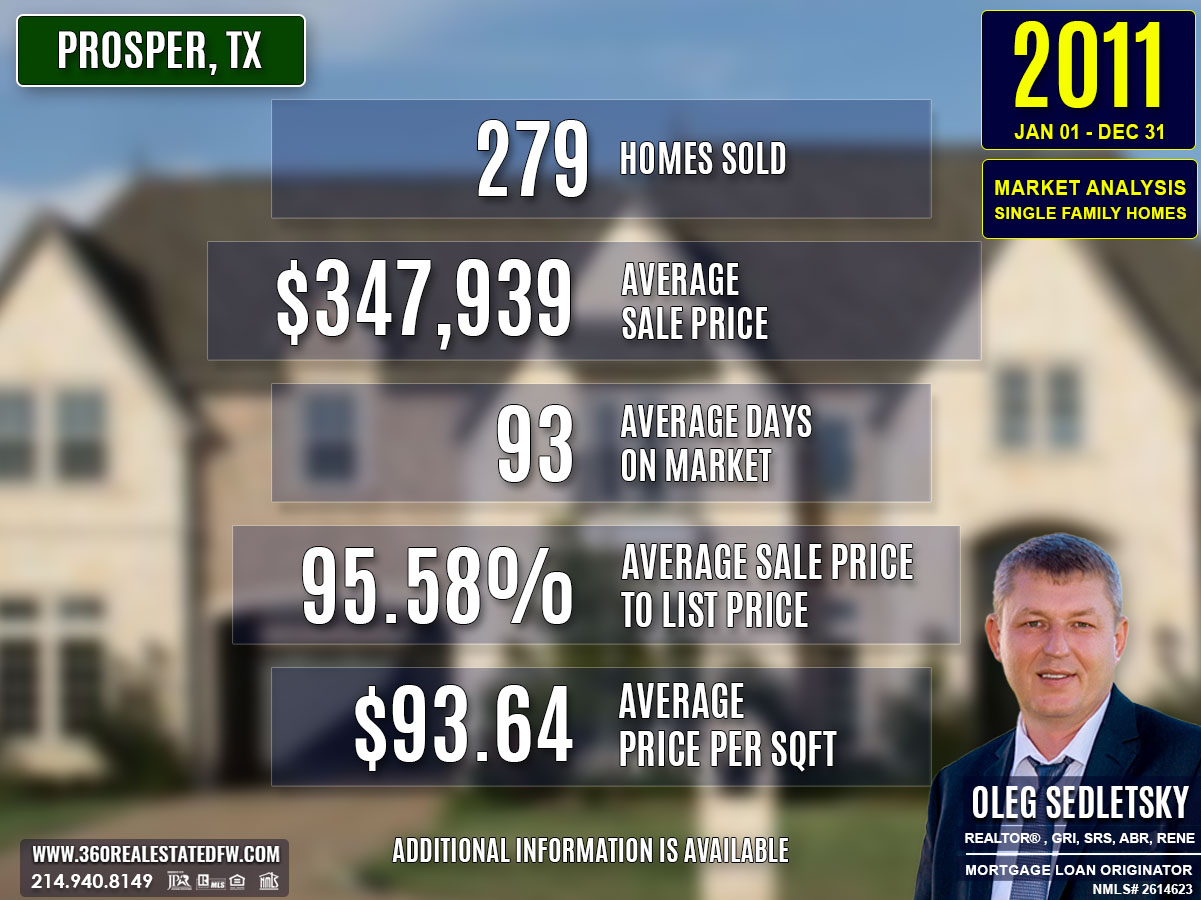
A total of 279 single-family homes closed in Prosper in 2011, marking a 21% rise from 2010’s total of 231 homes. This increase could signal greater buyer confidence and activity in the market.
New Construction Homes: 157 new homes were sold, illustrating a significant 78% increase from the prior year and underscoring the city’s focus on growth and development.
Homes with Pools: 41 properties featured pools, slightly fewer than the previous year but still a notable option for buyers seeking luxury amenities.
Property Pricing Insights
- Minimum Price: $98,000
- Maximum Price: $1,499,000
- Average Price: $347,939
- Median Price: $310,000
The year witnessed diversification in pricing, with both entry-level affordability and record-breaking luxury transactions shaping the market’s trajectory.
Property Size and Features
- Bedrooms & Bathrooms: On average, homes featured 4 bedrooms and 4 bathrooms, maintaining similarities to the previous year.
- Square Footage: Properties ranged from 1,355 sq. ft. to 11,950 sq. ft., with an average of 3,659 sq. ft., slightly higher than in 2010.
- Lot Size: Lot sizes remained similar, with the largest lot at 5.625 acres, indicating a balance between urban and suburban appeal.
Market Dynamics
- Days on Market (DOM): The average DOM was 93 days, a marginal improvement from 97 days in 2010.
- ClsPr/LstPr & ClsPr/OLP Ratios: The average close price to listing price ratio was 95.58%, reflecting a slight dip from 96.82% in 2010. The close price to original listing price stood at 92.10%, indicating sellers were adjusting initial pricing more frequently.
- Average Price Per Square Foot: $93.64, signaling a slight drop in price relative to property size compared to the prior year ($96.47).
Insights into the Most Expensive Prosper, TX Property Sold in 2011
The most expensive property sold in 2011 was an opulent 4-bedroom, 5-bathroom estate spanning 5,972 sq. ft. This luxury home brought sophistication and grandeur to the Prosper market, exemplified through its premium design and ideal location. Key metrics for this standout home include:
- Sold Price: $1,499,000
- Price Per Square Foot: $251.00
- Lot Size: 3.081 acres
- Days on Market (DOM): 143 days
- ClsPr/LstPr & ClsPr/OLP Ratios: Both at 100%, showing excellent pricing alignment.
- Year Built: 2001
The sale of this estate elevated market benchmarks for 2011, showcasing Prosper’s capacity to attract high-end buyers and developers willing to invest in luxury offerings.
Economic context
Average Electricity Costs in Dallas-Fort Worth in 2011
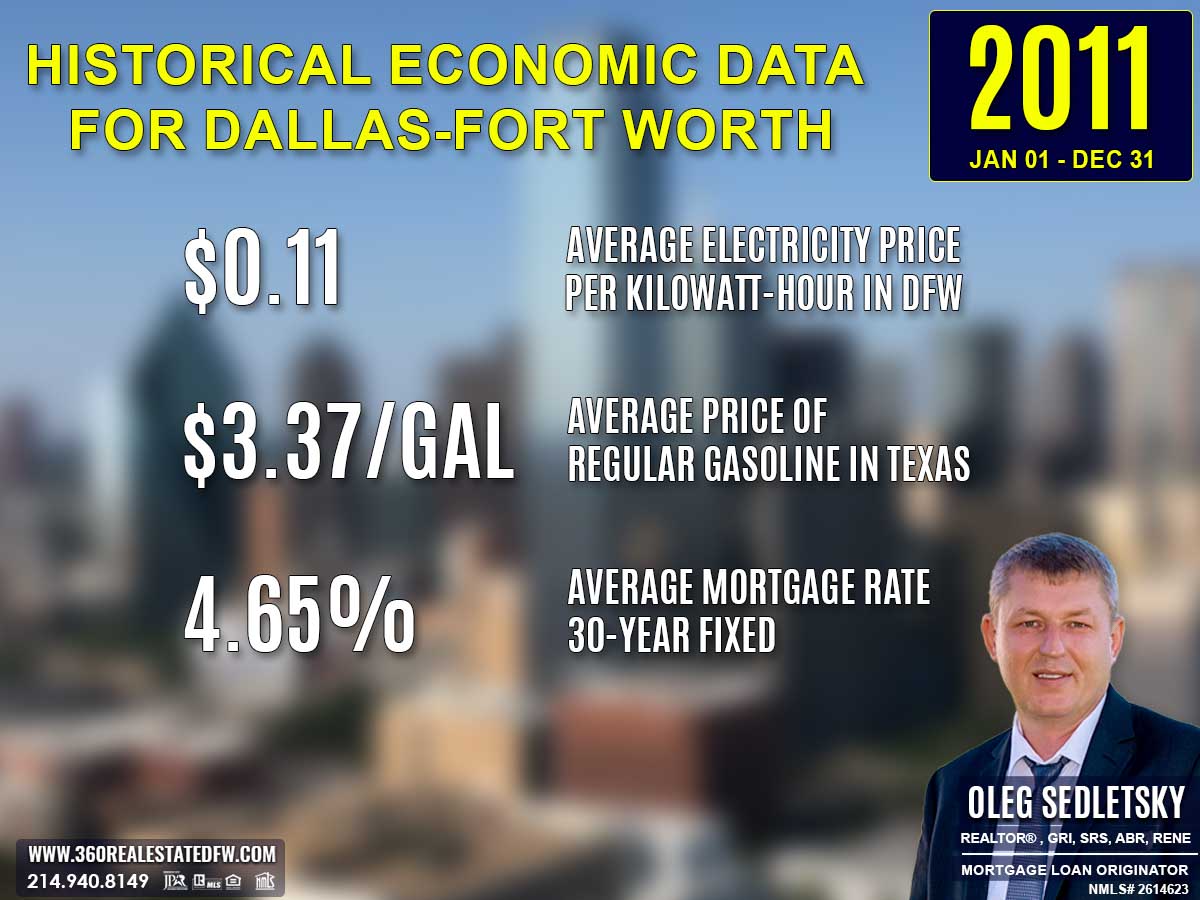
Electricity prices dipped again to $0.11 per kilowatt-hour in 2011, down from $0.12 in 2010. This slight drop continued to help households manage their budgets with more flexibility for discretionary spending or home-related investments. The lower cost of utilities could boost the appeal of larger homes that might otherwise consume more electricity.
Average Price for Regular Gasoline in Texas in 2011
Gas prices rose noticeably to $3.37 per gallon in 2011, up from $2.64 in 2010. The steep increase likely caused homebuyers to favor properties closer to work or transit hubs. homebuyers in suburban or rural areas likely faced greater challenges due to higher commuting costs.
Average 30-Year Fixed Mortgage Rate in 2011
Mortgage rates dropped further to 4.65% in 2011 from 4.86% in the prior year. This ongoing trend of declining rates supported affordability and encouraged activity among homebuyers. First-time buyers were reminded to get pre-approved through local mortgage loan originators to better understand their purchasing power.
Curious about today’s mortgage rates and the home you can comfortably afford?
Submit a no-obligation mortgage application today and get pre-approved to determine your budget and take the first step toward homeownership with confidence.
Overview of Differences Between the 2010 and 2011 Real Estate Markets in Prosper, Texas
Volume of Sales
The number of homes sold rose notably, from 231 in 2010 to 279 in 2011, reflecting increased buyer activity and market demand (a 21% increase).
Pricing
- Average Price decreased slightly, from $354,201 in 2010 to $347,939 in 2011, signaling stable yet slightly softer pricing trends.
- Minimum Price increased marginally, from $97,000 to $98,000, suggesting a small rise in the entry-level sector.
- Maximum Price surged from $875,000 in 2010 to a record $1,499,000 in 2011, driven by luxury market expansion.
Market Efficiency
Close Price to Listing Price Ratio slipped slightly from 96.82% in 2010 to 95.58% in 2011, indicating minor market adjustments.
Days on Market (DOM) improved, dropping from 97 days to 93 days, showing a quicker market turnover.
Property Features
- Average property sizes saw modest growth, with 3,610 sq. ft. in 2010 increasing to 3,659 sq. ft. in 2011.
- Maximum square footage jumped significantly, from 7,262 sq. ft. to 11,950 sq. ft., a reflection of high-end properties entering the market.
- Bedroom and bathroom averages remained consistent, at 4 bedrooms and 4 bathrooms.
- Lot sizes stayed relatively constant, with slight fluctuations in maximum acreage.
The comparison highlights a more dynamic market in 2011, with increased sales, a rise in luxury property activity, and faster market movements while maintaining consistency in property features.
Summary of Real Estate Market Analysis for Prosper, TX in 2011
The 2011 real estate market in Prosper, Texas presented unique opportunities and challenges for both homebuyers and home-sellers.
Homebuyers’ Perspective
For homebuyers, the year offered a significant range of options, from affordable starter homes to high-end luxury properties. The increase in new construction sales delivered an appealing variety for buyers seeking modern homes. With mortgage rates at an average of 4.65%, affordability was within reach for many, though rising gas prices and other economic factors required buyers to carefully assess their budgets. Faster market turnover emphasized the need for quick decision-making to secure desirable properties.
Home-Sellers’ Perspective
For home sellers, the market conditions reinforced the importance of strategic pricing. The slight dip in close price to listing price ratios and the close price to original listing price trends indicated that overpricing often resulted in price adjustments and extended days on market. However, sellers who priced appropriately benefited from efficient sales and strong demand, especially for well-maintained or luxury properties.
The Importance of Statistical Data in Prosper, Texas Real Estate Market
Did you know that Appraisers and Realtors rely on historical statistical data to determine a property’s current value?
The data above is just the beginning. This glimpse into the Prosper, Texas real estate market outlines trends but doesn’t capture the full picture. To truly understand the city’s housing market, you’ll need specific insights like zip code analyses, neighborhood breakdowns, and school-district-focused data. Historical trends and comprehensive analyses arm both homebuyers and home sellers with the tools they need to make decisions confidently.
The insights on this page represent just a small part of the comprehensive real estate services I provide to my clients. Whether you’re a buyer aiming to find your dream home or a seller looking to maximize your property’s value, I provide data-backed strategies tailored to your goals.
Reach out today—I’d love to help you achieve success in Prosper’s vibrant housing market!
Unlock Exceptional Service!
Assistance with all your real estate needs in the Dallas-Fort Worth area is just a click or call away. Reach out at 214-940-8149 or connect through the links below.
Meet Your Trusted Realtor and Mortgage Expert in Prosper, Texas!

Oleg Sedletsky REALTOR® in Prosper, Texas. Call/Text 214.940.8149
Greetings! I’m Oleg Sedletsky, and I’m excited to introduce myself as your go-to full-time licensed Texas REALTOR® and Mortgage Loan Originator.
I proudly represent JPAR® – Real Estate Brokerage as a REALTOR® and Utopia Mortgage LLC as a Mortgage Loan Originator! My designations and certifications reflect my dedication to helping you achieve your real estate goals in Prosper, TX and other locations in the vibrant Dallas-Fort Worth area!
With my expertise, I’ll provide you with in-depth resources, including detailed market reports and historical data, to help you make confident, well-informed decisions. Fluent in English, Ukrainian, and Russian, I’m here to guide you through every step of the process with personalized support and dedication.
It’s All About You and Your Real Estate Goals!
My mission is to serve you! With my knowledge and expertise, I’m here to help you achieve all your real estate goals!
I’m passionate about helping homebuyers and home-sellers navigate the exciting real estate landscape in Prosper, Texas! Whether you’re searching for your dream home, exploring land options, or looking for commercial properties, my Real Estate Services have you covered.
Contact me today for all your real estate needs in Prosper, Texas! Call/text 214-940-8149

A Comprehensive Analysis of Single-Family Residential Housing Market in Prosper, TX: 2010 to Present
Discover the trends, stats, and insights shaping Prosper’s real estate market year by year!
2010-2020
Prosper, TX Real Estate Market Report 2010: Analysis and Trends
Prosper, TX Real Estate Market Report 2011: Analysis and Trends
Prosper, TX Real Estate Market Report 2012: Analysis and Trends
Prosper, TX Real Estate Market Report 2013: Analysis and Trends
Prosper, TX Real Estate Market Report 2014: Analysis and Trends
Prosper, TX Real Estate Market Report 2015: Analysis and Trends
Prosper, TX Real Estate Market Report 2016: Analysis and Trends
Prosper, TX Real Estate Market Report 2017: Analysis and Trends
Prosper, TX Real Estate Market Report 2018: Analysis and Trends
Prosper, TX Real Estate Market Report 2019: Analysis and Trends
Prosper, TX Real Estate Market Report 2020: Analysis and Trends
This market analysis is intended solely for educational purposes. This market analysis is based on data sourced from NTREIS, Inc. This analysis is exclusively focused on single-family homes and does not account for other property types. The total number of real estate transactions within the specified period and location may vary. Data accuracy cannot be guaranteed due to potential input errors made by NTREIS users. This market analysis does not account for all new construction home sales. If you need detailed information about recorded property sales or other public records, please contact the appropriate city or county office.