
The 2018 Princeton, Texas real estate market showcased rapid growth fueled by robust new construction activity, rising home prices, and increasing demand. This analysis uncovers key market patterns and trends, providing a detailed breakdown of sales data, property characteristics, and economic factors shaping the year.
Key Takeaways and Trends from Princeton’s 2018 Real Estate Market
Pricing Range: Homes spanned from $72,000 to $599,000, with average and median prices trending upward. The market was increasingly segmented, with opportunities for first-time buyers and luxury clients alike.
Market Efficiency: While DOM increased to 30 days, price per square foot and turnover in luxury properties suggest strong underlying demand.
Unique Outliers: The normalized ClsPr/OLP ratio and growth in pool home sales reflect shifts in inventory and homebuyer desires.
Mortgage Rates Impact: Higher rates of 4.70%, up from 4.14% in 2017, likely weighed on market entry points but were offset by rising wages and economic optimism.
Total Homes Closed
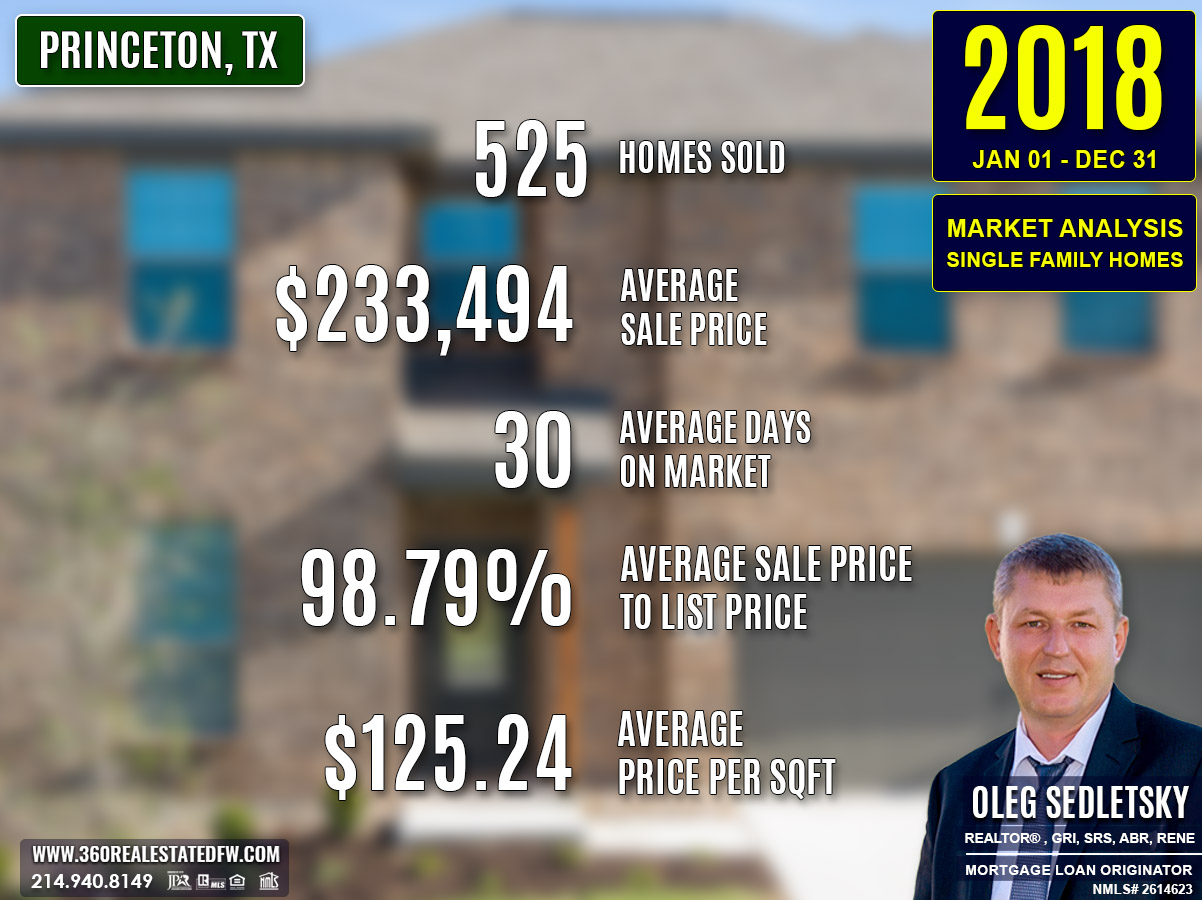
- Closed transactions: A total of 525 homes sold, reflecting strong activity and a 25.9% increase from 2017’s 417 sales.
- New construction homes: 264 homes, a remarkable rise from 187 in 2017, indicating a booming housing development sector.
- Homes with pools: Sales rose to 10 homes, up from 6 in the prior year, showing increased interest in luxury amenities.
Property Pricing Insights
The pricing metrics for 2018 denote steady growth across all segments:
- Minimum price: Increased from $62,000 to $72,000, suggesting higher minimum valuations per property.
- Maximum price: Rose from $540,000 to $599,000, driven by luxury sector demand.
- Average price: Climbed 8.5%, from $215,261 to $233,494, reflecting overall market appreciation.
- Median price: Jumped to $228,900, up 6% from $215,900, showcasing a healthier mid-market sector.
Property Size and Features
The Princeton, TX real estate market in 2018 served buyers with diverse needs, offering properties across a range of specifications:
- Bedrooms: An average of 4 bedrooms, consistent with 2017.
- Bathrooms: Typically 2 bathrooms, maintaining similar trends to the prior year.
- Square footage: Homes ranged from 840 sqft to 3,907 sqft, with 1,897 sqft as the average, up slightly from 1,882 sqft in 2017.
- Lot sizes: Averaged 0.377 acres, compared to 0.361 acres in 2017, reflecting slight growth in property space.
Market Dynamics
Efficiency remained a central theme with slight adjustments to specific metrics:
- Days on Market (DOM): Homes required an average of 30 days to sell, up from 23 days in 2017, signaling a longer turnover cycle.
- ClsPr/LstPr Ratio: Slight dip to 98.79%, showing slightly softer negotiations compared to 99.41% in 2017.
- ClsPr/OLP Ratio: Dropped to 97.81%, normalizing after the overbidding anomalies in 2017’s 134.60%.
- Average price per sqft: Grew to $125.24, up from $116.61, representing a 7.4% increase in property value per unit of space.
Insights into the Most Expensive Princeton, TX Property Sold in 2018
The year’s luxury sale was a stunning estate that captured attention for its exceptional features:
- Price: $599,000
- Beds/Baths: 4 bedrooms, 5 bathrooms (3 full, 2 half)
- Square Footage: 3,725 sqft
- Price per sqft: $160.81
- Lot Size: 5.330 acres
- Days on Market (DOM): 8 days
- ClsPr/LstPr Ratio: 100.00%
- ClsPr/OLP Ratio: 100.00%
- Year Built: 2008
- Unique Feature: Pool and spacious acreage
This premium sale underscored the rise of high-end properties in Princeton, reflecting buyers’ willingness to invest in luxury amenities like pools and expansive lots. Its quick sale time of 8 days highlights strong demand for upscale homes.
Economic context
Average Electricity Costs in Dallas-Fort Worth in 2018
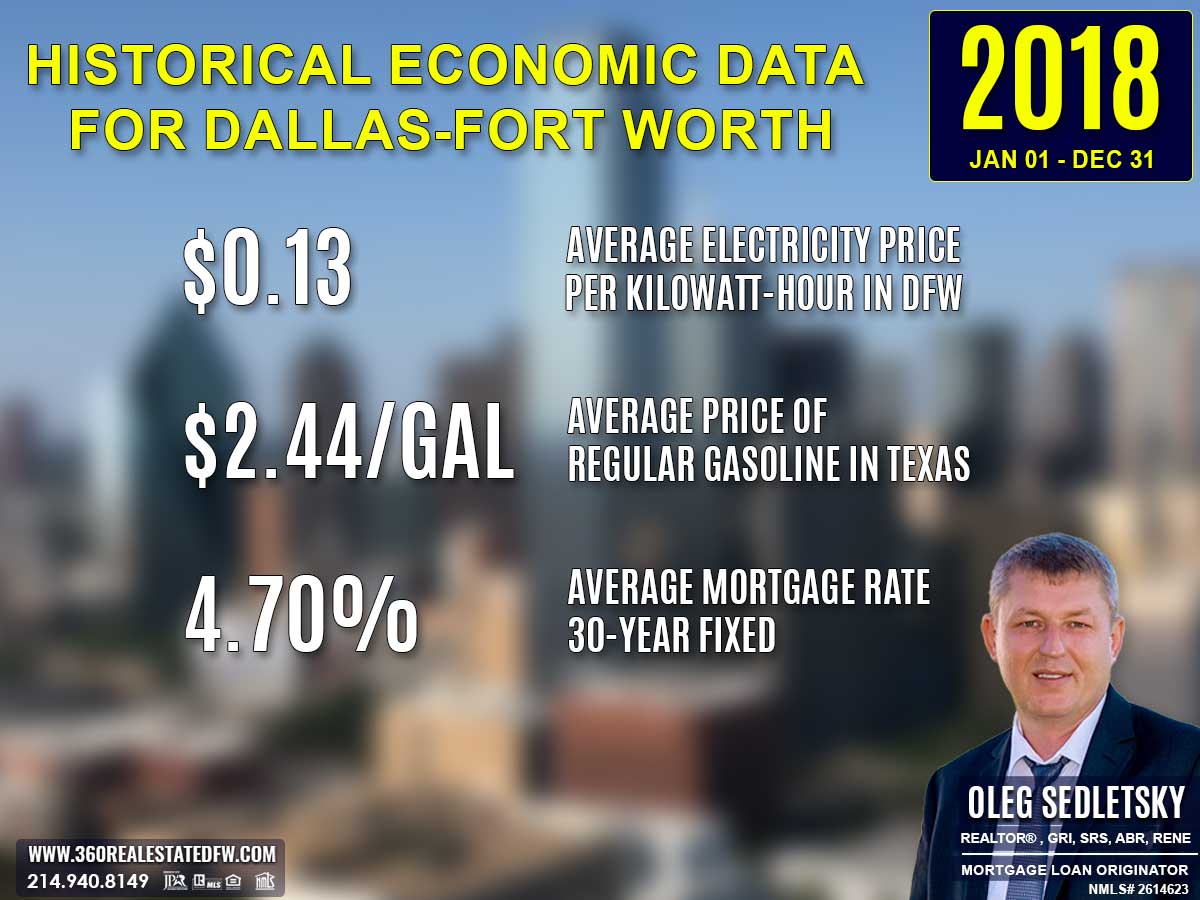
Electricity prices increased to $0.13 per kilowatt-hour in 2018, compared to $0.12 in 2017. This climb likely drove demand for energy-efficient housing and renovations, placing greater emphasis on properties with modern upgrades that helped households manage increasing utility costs.
Average Price for Regular Gasoline in Texas in 2018
Gas prices also rose, reaching $2.44 per gallon in 2018, up from $2.19 in 2017. With transportation becoming more expensive, proximity to workplaces and public transportation remained important for homebuyers. Walkable neighborhoods and mixed-use developments gained traction during this period.
Average 30-Year Fixed Mortgage Rate in 2018
Mortgage rates climbed to 4.70% in 2018, from 4.14% in the previous year. For many homebuyers, this level of interest rate signaled urgency to act before rates increased further. Getting pre-approved by a local mortgage loan originator was pivotal for navigating the pressures of a market increasingly shaped by rising rates.
Curious about today’s mortgage rates and the home you can comfortably afford?
Submit a no-obligation mortgage application today and get pre-approved to determine your budget and take the first step toward homeownership with confidence.
Overview of Differences Between the 2017 and 2018 Real Estate Markets in Princeton, Texas
Volume of Sales
Homes sold increased significantly, rising from 417 in 2017 to 525 in 2018, marking a 25.9% growth.
Pricing
- Minimum price: Increased from $62,000 to $72,000, reflecting rising property entry points.
- Maximum price: Grew from $540,000 to $599,000, driven by demand in the luxury segment.
- Average price: Climbed 8.5%, from $215,261 to $233,494, indicating a strong appreciation across the market.
- Median price: Rose by 6%, from $215,900 to $228,900, emphasizing the upward shift in mid-market properties.
Market Efficiency
- Days on Market (DOM): Increased slightly from 23 days to 30 days, signaling a slower turnover rate.
- ClsPr/LstPr Ratio: Drifted lower from 99.41% to 98.79%, pointing to marginally softer negotiations.
- ClsPr/OLP Ratio: Normalized from a high of 134.60% in 2017 to 97.81%, reducing anomalies seen previously.
Property Features
- Square footage: Averaged 1,897 sqft in 2018, a slight increase from 1,882 sqft in 2017, expanding property sizes.
- Lot size: Rose modestly from .361 acres to .377 acres, reflecting larger land offerings.
- Homes with pools: Almost doubled, growing from 6 sales in 2017 to 10 sales in 2018, highlighting luxury demand.
- New construction homes: Surged by 41%, from 187 to 264, demonstrating a booming development market.
Economic Context
- Mortgage rates: Climbed from 4.14% to 4.70%, making borrowing more expensive.
- Gas prices: Increased from $2.19 to $2.44 per gallon, and electricity costs rose from $0.12 to $0.13 per kilowatt hour, slightly raising overall living costs.
Princeton’s 2018 market displayed robust growth in sales and pricing, driven by increased demand and a surge in new construction, counterbalanced by slightly slower efficiency and higher economic costs.
Summary of Real Estate Market Analysis for Princeton, TX in 2018
Princeton’s real estate market in 2018 maintained its upward momentum, with strong gains in sales volume, pricing, and new construction. While affordability faced headwinds with higher interest rates, the market continued to grow through diversified inventory and demand across all buyer segments. The luxury market thrived with standout sales, like the $599,000 estate.
The Importance of Statistical Data in Princeton, Texas Real Estate Market
Did you know that appraisers and Realtors rely on historical statistical data to determine a property’s current value?
Analyzing historical market data is essential for making informed decisions in today’s real estate market. Examining past trends provides valuable insights that facilitate accurate pricing, more strategic negotiations, and a comprehensive understanding of market dynamics. By understanding market dynamics, both homebuyers and home-sellers can leverage the conditions to achieve their goals.
Unlock Exceptional Service!
Assistance with all your real estate needs in the Dallas-Fort Worth area is just a click or call away. Reach out at 214-940-8149 or connect through the links below.

Oleg Sedletsky REALTOR® in Princeton, Texas. Call/Text 214.940.8149
Greetings! I’m Oleg Sedletsky, and I’m excited to introduce myself as your go-to full-time licensed Texas REALTOR® and Mortgage Loan Originator.
I proudly represent JPAR® – Real Estate Brokerage as a REALTOR® and Utopia Mortgage LLC as a Mortgage Loan Originator! My designations and certifications reflect my dedication to helping you achieve your real estate goals in Princeton, TX and other locations in the vibrant Dallas-Fort Worth area!
My commitment to ongoing professional development means I’m always enhancing my skills to serve you better. You can count on me as your trusted expert throughout your real estate journey. Plus, I’m fluent in English, Ukrainian, and Russian and ready to assist you every step of the way!
It’s All About You and Your Real Estate Goals!
My mission is to serve you! With my knowledge and expertise, I’m here to help you achieve all your real estate goals!
I’m passionate about helping buyers and sellers navigate the exciting real estate landscape in Princeton, Texas! Whether you’re searching for your dream home, exploring land options, or looking for commercial properties, my Real Estate Services have you covered.
Contact me today for all your real estate needs in Princeton, Texas! Call/text 214-940-8149

A Comprehensive Analysis of Single-Family Residential Housing Market in Princeton, TX: 2010 to Present
Discover the trends, stats, and insights shaping Princeton’s real estate market year by year!
2010-2020
Princeton, TX Real Estate Market Report 2010: Analysis and Trends
Princeton, TX Real Estate Market Report 2011: Analysis and Trends
Princeton, TX Real Estate Market Report 2012: Analysis and Trends
Princeton, TX Real Estate Market Report 2013: Analysis and Trends
Princeton, TX Real Estate Market Report 2014: Analysis and Trends
Princeton, TX Real Estate Market Report 2015: Analysis and Trends
Princeton, TX Real Estate Market Report 2016: Analysis and Trends
Princeton, TX Real Estate Market Report 2017: Analysis and Trends
Princeton, TX Real Estate Market Report 2018: Analysis and Trends
Princeton, TX Real Estate Market Report 2019: Analysis and Trends
Princeton, TX Real Estate Market Report 2020: Analysis and Trends
This market analysis is intended solely for educational purposes. This market analysis is based on data sourced from NTREIS, Inc. This analysis is exclusively focused on single-family homes and does not account for other property types. The total number of real estate transactions within the specified period and location may vary. Data accuracy cannot be guaranteed due to potential input errors made by NTREIS users. This market analysis does not account for all new construction home sales. If you need detailed information about recorded property sales or other public records, please contact the appropriate city or county office.