
The 2015 real estate market in Princeton, Texas showcased stability in volume while achieving growth in pricing and efficiency. This analysis explores data trends across closed transactions, pricing, features, and market dynamics, providing insights into the market’s health and direction.
Key Takeaways and Trends from Princeton’s 2015 Real Estate Market
- Pricing Range
Property prices remained accessible at the low end ($38,000) while maintaining mid-tier growth. High-end sales shifted lower, with no transactions surpassing $407,500 compared to 2014’s $675,000. - Market Efficiency
Homes sold notably faster in 2015, averaging 36 days on market compared to 52 in 2014. Sellers achieved higher close-price-to-list ratios, reflecting strong buyer interest and competition. - Unique Outliers
The $407,500 home with 10 acres and the unprecedented over-list-price ratios of 144.99% signaled a particularly dynamic landscape, especially for specific segments. - Mortgage Rates Impact
Mortgage rates dropped to 3.99%, down from 4.31% in 2014, boosting affordability and likely fueling increased market efficiency.
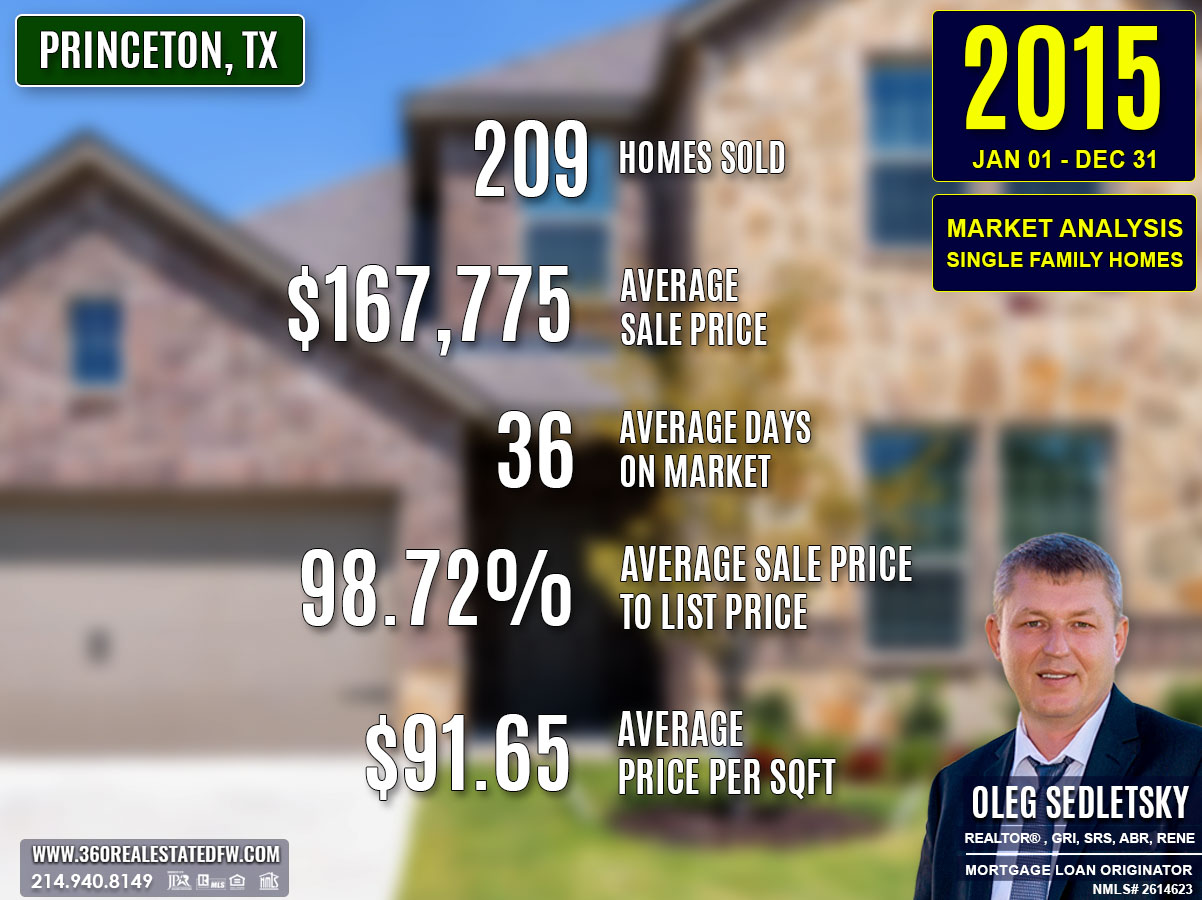
Total Homes Closed
- Closed transactions: 209 homes, maintaining consistent activity from 2014.
- New construction homes: 15 homes, marking a notable decline from 35 in 2014 but with sustained buyer interest.
- Homes with pools: 9 homes sold, matching the previous year, showing steady demand for lifestyle-driven features.
Property Pricing Insights
Pricing trends in 2015 exhibited growth and pointed to Princeton’s strengthening market.
- Minimum price: $38,000, up from $30,000 in 2014, reflecting improvements at the entry-level.
- Maximum price: $407,500, significantly lower than 2014’s $675,000, indicating a shift in luxury sales.
- Average price: Increased to $167,775, an 7.5% rise from the previous year.
- Median price: Grew to $163,000, climbing from $148,000—a 10.1% increase.
Property Size and Features
Princeton homebuyers continued to seek varied property sizes and amenities, reinforcing the market’s diversity.
- Bedrooms: Most properties featured 3 bedrooms, aligning with consumer preferences.
- Bathrooms: Homes averaged 2 bathrooms, with configurations ranging from 1 to 4 bathrooms.
- Square footage: Sizes ranged from 624 sqft to 3,393 sqft, with an average of 1,844 sqft, slightly smaller than 2014’s average of 1,891 sqft.
- Lot sizes: Averaged 0.682 acres, a minor decline from 2014’s 0.815 acres, though still spacious.
Market Dynamics
The 2015 market demonstrated increased momentum and strong value propositions.
- Days on Market (DOM): Properties sold faster, averaging 36 days, down from 52 days in 2014.
- ClsPr/LstPr Ratio: Improved to 98.72% from 97.74%, reflecting tighter negotiations.
- ClsPr/OLP Ratio: Jumped dramatically to 144.99%, driven by specific outliers such as underpriced listings producing over-asking bids.
- Average price per sqft: Increased to $91.65, continuing the upward trend from 2014’s $82.05.
Insights into the Most Expensive Princeton, TX Property Sold in 2015
The highest-priced property sold in 2015 was a stunning home with modern features and a fast closing time. Here are the details:
- Price: $407,500
- Beds/Baths: 3 bedrooms, 3 bathrooms (2 full, 1 half)
- Square Footage: 2,253 sqft
- Price per sqft: $180.87
- Lot Size: 10 acres (sprawling estate)
- Days on Market (DOM): 8 days
- ClsPr/LstPr Ratio: 101.88%
- ClsPr/OLP Ratio: 101.88%
- Year Built: 1997
This property highlighted Princeton’s evolving estate market, catering to homebuyers seeking expansive lots and luxury pricing. With just 8 DOM and a closing rate above asking price, it showcased the continuing desirability of high-end homes in 2015.
Economic context
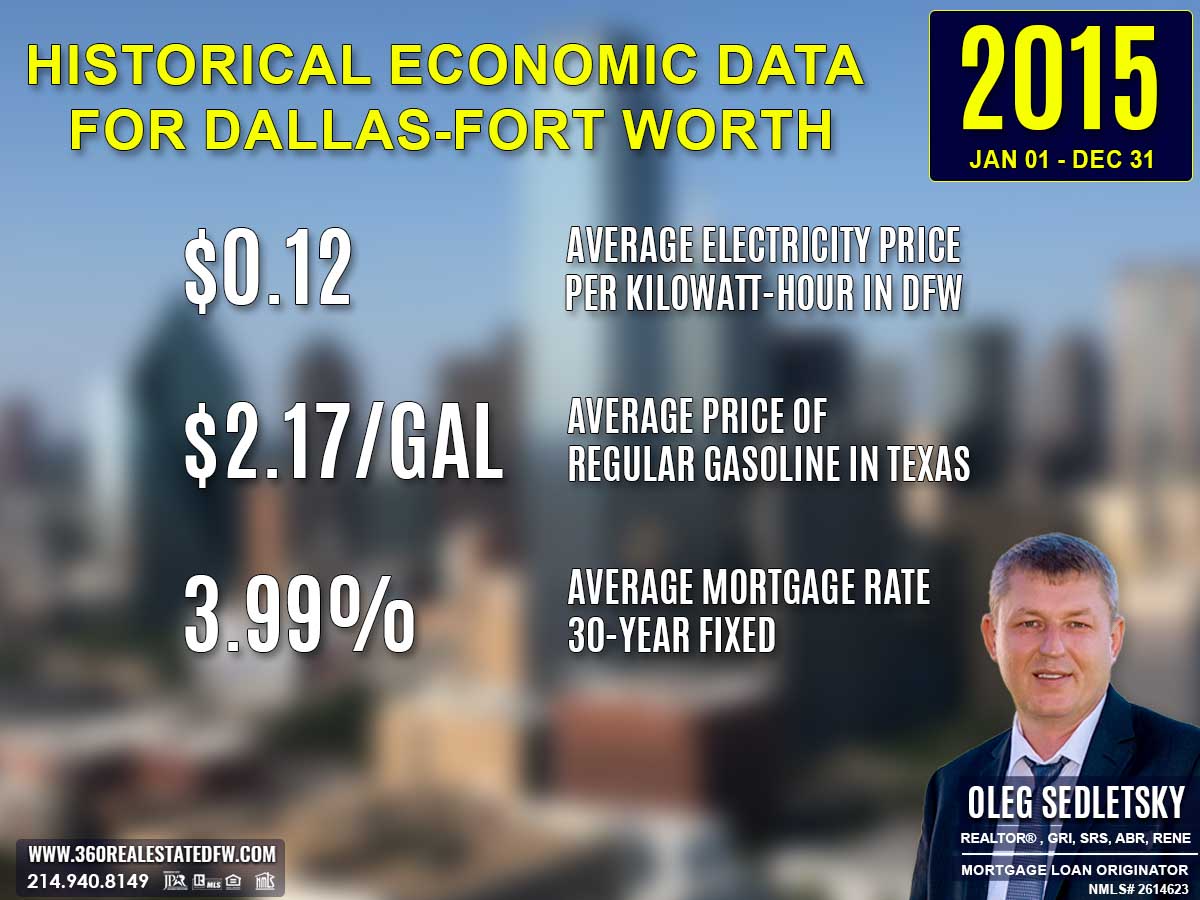
Average Electricity Costs in Dallas-Fort Worth in 2015
Electricity prices dipped to $0.12 per kilowatt-hour in 2015, down from $0.13 in 2014. This small decrease likely provided a bit of financial breathing room to households, which could have been channeled into homeownership costs. Prospective homebuyers looking for energy-friendly homes continued to dominate market trends.
Average Price for Regular Gasoline in Texas in 2015
Gas prices fell significantly to $2.17 per gallon in 2015, down from $3.15 in 2014. Plummeting fuel costs were a game-changer for homebuyers considering longer commutes. Lower transportation expenses made suburban and rural areas increasingly attractive, potentially driving demand for properties in these regions.
Average 30-Year Fixed Mortgage Rate in 2015
Mortgage rates declined slightly to 3.99% in 2015, down from 4.31% in 2014. homebuyers took advantage of this drop to enter the housing market or refinance existing loans for more affordable terms. Partnering with a local mortgage loan originator to secure pre-approval was crucial for those navigating the competitive environment fueled by lower rates.
Curious about today’s mortgage rates and the home you can comfortably afford?
Submit a no-obligation mortgage application today and get pre-approved to determine your budget and take the first step toward homeownership with confidence.
Overview of Differences Between the 2014 and 2015 Real Estate Markets in Princeton, Texas
Volume of Sales
Sales held steady with 209 homes sold in both 2014 and 2015, indicating a stable demand.
Pricing
- Minimum price: Increased from $30,000 in 2014 to $38,000 in 2015, reflecting rising entry-level home values.
- Maximum price: Dropped sharply from $675,000 in 2014 to $407,500, suggesting fewer ultra-luxury transactions.
- Average price: Increased by 7.5%, moving from $156,171 to $167,775.
- Median price: Grew by 10.1%, rising from $148,000 to $163,000, showcasing stronger mid-range market performance.
Market Efficiency
- Days on Market (DOM): Homes sold significantly faster, averaging 36 days compared to 52 days in 2014.
- ClsPr/LstPr Ratio: Improved from 97.74% to 98.72%, indicating stronger list price retention.
- ClsPr/OLP Ratio: Increased dramatically from 96.17% in 2014 to 144.99%, driven by outlier sales like underpriced homes attracting over-list bids.
Property Features
- Average square footage: Slightly decreased from 1,891 sqft in 2014 to 1,844 sqft in 2015.
- Lot size: Declined from 0.815 acres to 0.682 acres, with some exceptions for larger properties.
- Homes with pools: Remained steady at 9, showing consistent demand for homes with leisure amenities.
- New construction homes: Dropped from 35 in 2014 to 15 in 2015, signifying reduced construction activity.
Economic Context
- Mortgage rates: Fell from 4.31% to 3.99%, likely accelerating sales and affordability.
- Gas prices: Dropped significantly from $3.15 to $2.17 per gallon, reducing overall household expenses and potentially increasing disposable income for buyers.
- Electricity costs: Decreased slightly, from $0.13 to $0.12 per kilowatt-hour, further easing monthly costs.
The 2015 Princeton, TX real estate market reflected stability in sales while achieving faster transactions, higher mid-market price growth, and improved buyer competition, driven by favorable economic conditions and shifting property preferences.
Summary of Real Estate Market Analysis for Princeton, TX in 2015
The 2015 Princeton, Texas real estate market demonstrated resilience and heightened activity, achieving faster sales and increased pricing despite reduced new construction and luxury activity. Stable volume and diverse price points reaffirmed Princeton as an attractive market with strong buyer demand. These trends suggest continued adaptability and strength moving forward into 2016.
The Importance of Statistical Data in Princeton, Texas Real Estate Market
Did you know that appraisers and Realtors rely on historical statistical data to determine a property’s current value?
Analyzing historical market data is essential for making informed decisions in today’s real estate market. Examining past trends provides valuable insights that facilitate accurate pricing, more strategic negotiations, and a comprehensive understanding of market dynamics. By understanding market dynamics, both homebuyers and home-sellers can leverage the conditions to achieve their goals.
Unlock Exceptional Service!
Assistance with all your real estate needs in the Dallas-Fort Worth area is just a click or call away. Reach out at 214-940-8149 or connect through the links below.

Oleg Sedletsky REALTOR® in Princeton, Texas. Call/Text 214.940.8149
Greetings! I’m Oleg Sedletsky, and I’m excited to introduce myself as your go-to full-time licensed Texas REALTOR® and Mortgage Loan Originator.
I proudly represent JPAR® – Real Estate Brokerage as a REALTOR® and Utopia Mortgage LLC as a Mortgage Loan Originator! My designations and certifications reflect my dedication to helping you achieve your real estate goals in Princeton, TX and other locations in the vibrant Dallas-Fort Worth area!
My commitment to ongoing professional development means I’m always enhancing my skills to serve you better. You can count on me as your trusted expert throughout your real estate journey. Plus, I’m fluent in English, Ukrainian, and Russian and ready to assist you every step of the way!
It’s All About You and Your Real Estate Goals!
My mission is to serve you! With my knowledge and expertise, I’m here to help you achieve all your real estate goals!
I’m passionate about helping buyers and sellers navigate the exciting real estate landscape in Princeton, Texas! Whether you’re searching for your dream home, exploring land options, or looking for commercial properties, my Real Estate Services have you covered.
Contact me today for all your real estate needs in Princeton, Texas! Call/text 214-940-8149

A Comprehensive Analysis of Single-Family Residential Housing Market in Princeton, TX: 2010 to Present
Discover the trends, stats, and insights shaping Princeton’s real estate market year by year!
2010-2020
Princeton, TX Real Estate Market Report 2010: Analysis and Trends
Princeton, TX Real Estate Market Report 2011: Analysis and Trends
Princeton, TX Real Estate Market Report 2012: Analysis and Trends
Princeton, TX Real Estate Market Report 2013: Analysis and Trends
Princeton, TX Real Estate Market Report 2014: Analysis and Trends
Princeton, TX Real Estate Market Report 2015: Analysis and Trends
Princeton, TX Real Estate Market Report 2016: Analysis and Trends
Princeton, TX Real Estate Market Report 2017: Analysis and Trends
Princeton, TX Real Estate Market Report 2018: Analysis and Trends
Princeton, TX Real Estate Market Report 2019: Analysis and Trends
Princeton, TX Real Estate Market Report 2020: Analysis and Trends
This market analysis is intended solely for educational purposes. This market analysis is based on data sourced from NTREIS, Inc. This analysis is exclusively focused on single-family homes and does not account for other property types. The total number of real estate transactions within the specified period and location may vary. Data accuracy cannot be guaranteed due to potential input errors made by NTREIS users. This market analysis does not account for all new construction home sales. If you need detailed information about recorded property sales or other public records, please contact the appropriate city or county office.