
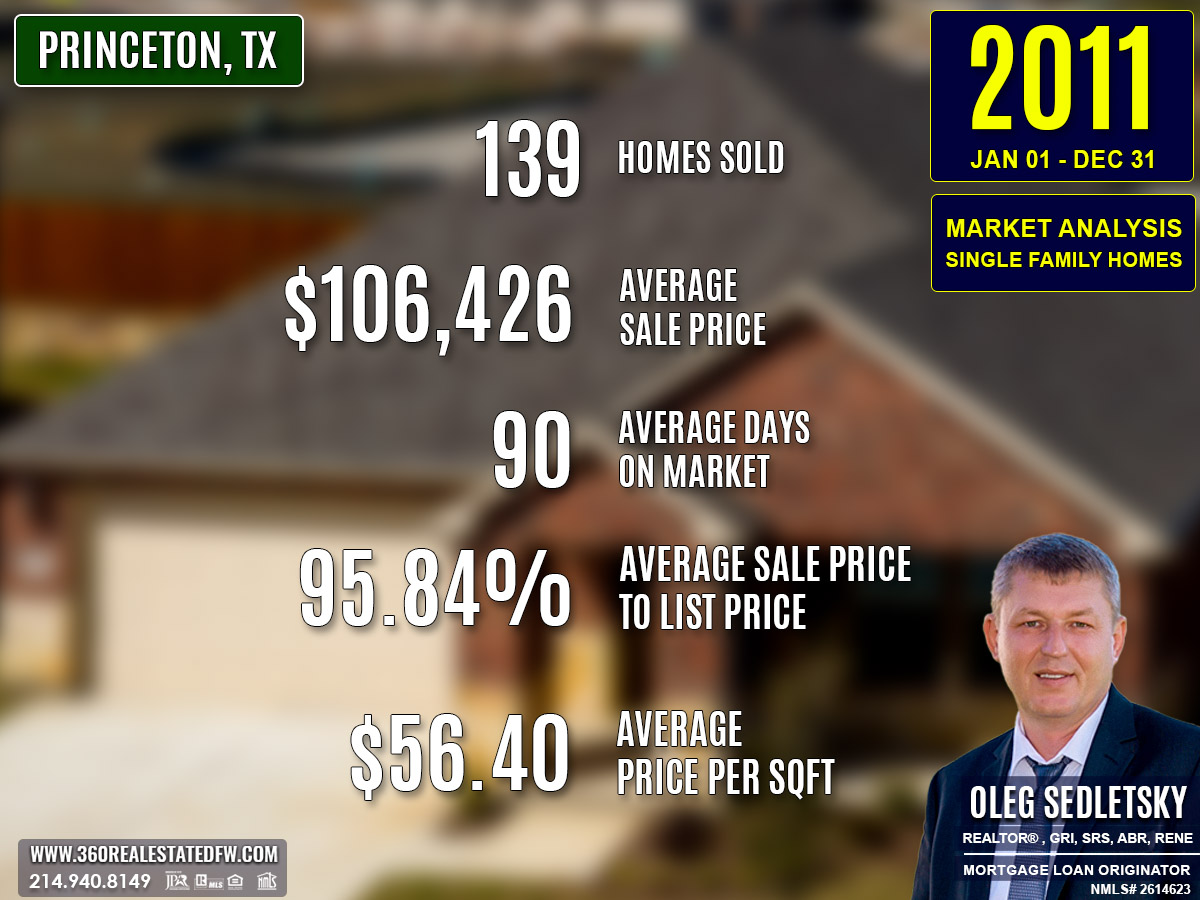
The Princeton, Texas real estate market in 2011 experienced notable changes compared to the previous year. This analysis explores 139 closed single-family home sales, providing insights into pricing, property sizes, market efficiency, and standout trends. I’ll further highlight the most expensive property sold and analyze the differences from the 2010 market.
Key Takeaways and Trends from Princeton’s 2011 Real Estate Market
Pricing Range: The range expanded slightly, from $13,000 to $550,000, with median and average prices dipping, reflecting more mid-market transactions.
Market Efficiency: With higher DOM and lower close-to-list ratios than 2010, the 2011 market experienced lengthier and possibly more competitive negotiations.
Unique Outliers: Luxurious homes, such as the 13-bedroom property, were sharp contrasts to more common mid-range housing options.
Mortgage Rates Impact: A slightly lower average mortgage rate of 4.65% (vs. 4.86% in 2010) should have incentivized more buyers; however, other economic factors, like increased average gas prices, may have tempered this boost.
Total Homes Closed
- Total homes closed in 2011 were 139, showcasing slightly lower activity compared to the 176 homes sold in 2010.
- New construction homes: 34 sales highlight a modest decrease in new builds compared to the prior year.
- Homes with pools: Only 1 sale involved a home with a pool, indicating a decline from 7 such properties in 2010.
Property Pricing Insights
The pricing landscape in 2011 revealed a wide range:
- Minimum price: $13,000 — an increase compared to 2010.
- Maximum price: $550,000 — slightly higher than the previous year.
- Average price: $106,426 — reflecting a modest decrease from 2010’s $115,316.
- Median price: $108,000 — slightly lower than last year’s $116,950.
This suggests a slight softening in home prices, with both middle and top-tier pricing showing minor shifts.
Property Size and Features
The range and average for property sizes and features show consistency:
- Bedrooms: Homes had an average of 3 bedrooms, ranging from 2 to 13 bedrooms.
- Bathrooms: The average was 2 full bathrooms, with homes providing a range of 1 to 6 bathrooms.
- Square footage: Properties ranged from 875 sqft to a substantial 6,735 sqft, averaging 1,846 sqft, showing minor growth from 2010.
- Lot Size: The average lot size was 0.748 acres, slightly smaller than last year, with lots extending up to 23.26 acres.
Variation in home size and lot area catered to diverse buyer preferences.
Market Dynamics
Key metrics illustrating market efficiency include:
- Days on Market (DOM): Homes averaged 90 days on market, a noticeable increase from the 74-day average in 2010.
- ClsPr/LstPr Ratio: On average, homes sold at 95.84% of their listing price, slightly dipping from the previous year.
- ClsPr/OLP Ratio: The ratio to the original listing price was 89.99%, indicating more significant price adjustments compared to 2010.
- Price per square foot: Averaged $56.40, reflecting a decline from the $63.87 in 2010.
These figures suggest a slightly less competitive market, with slower sales and lower pricing per square foot.
Insights into the Most Expensive Princeton, TX Property Sold in 2011
The pinnacle of 2011’s market activity was a luxury property that sold for $550,000. This home, featuring remarkable size and features, marked the highest sale of the year.
Key Metrics:
- Price: $550,000
- Beds/Baths: 13 bedrooms, 6 bathrooms (all full baths)
- Square Footage: 6,735 sqft
- Price per sqft: $81.66
- Lot Size: 12.00 acres
- Days on Market (DOM): 199 days
- ClsPr/LstPr Ratio: 100.00%
- ClsPr/OLP Ratio: 100.00%
- Year Built: 1999
Its significant size, competitive pricing, and full asking price sale make it a true outlier in the market.
Economic context
Average Electricity Costs in Dallas-Fort Worth in 2011
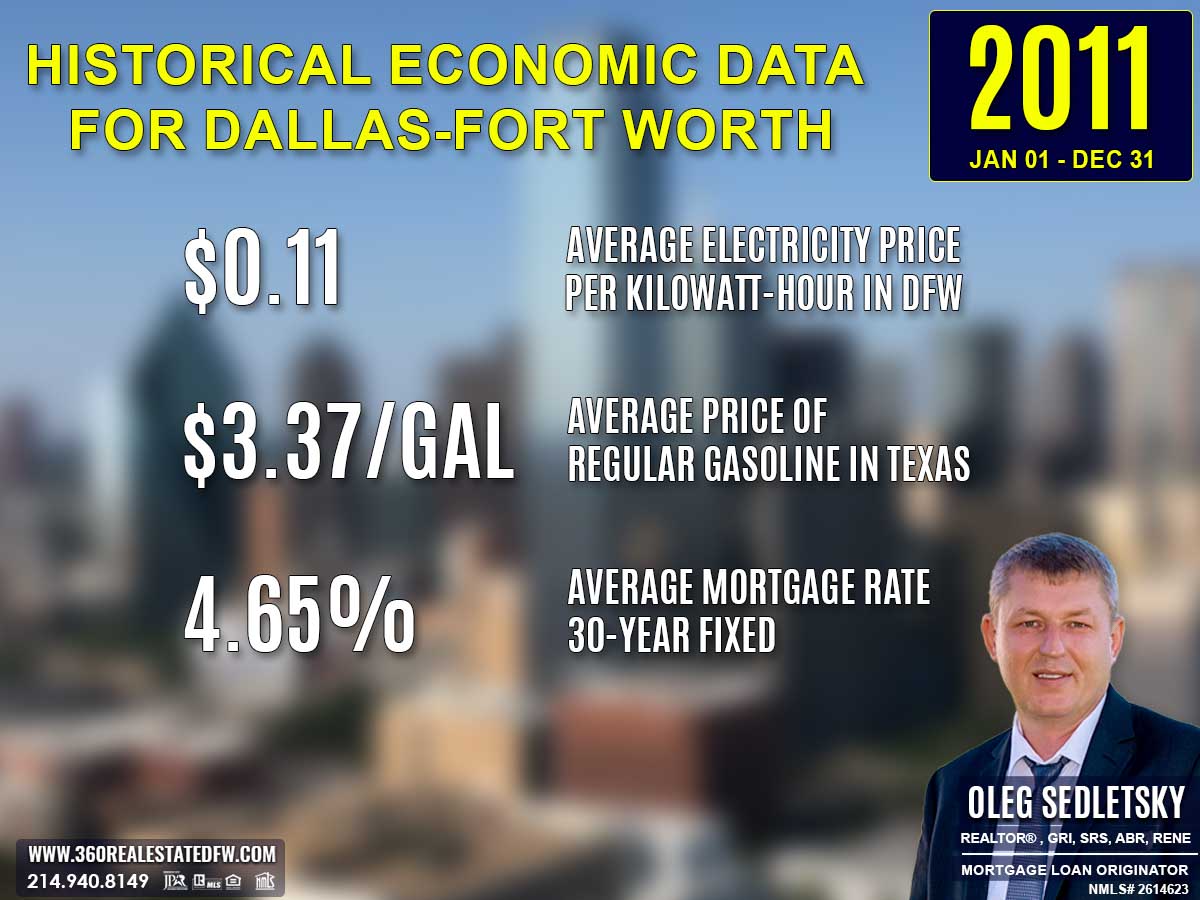
Electricity prices dipped again to $0.11 per kilowatt-hour in 2011, down from $0.12 in 2010. This slight drop continued to help households manage their budgets with more flexibility for discretionary spending or home-related investments. The lower cost of utilities could boost the appeal of larger homes that might otherwise consume more electricity.
Average Price for Regular Gasoline in Texas in 2011
Gas prices rose noticeably to $3.37 per gallon in 2011, up from $2.64 in 2010. The steep increase likely caused homebuyers to favor properties closer to work or transit hubs. homebuyers in suburban or rural areas likely faced greater challenges due to higher commuting costs.
Average 30-Year Fixed Mortgage Rate in 2011
Mortgage rates dropped further to 4.65% in 2011 from 4.86% in the prior year. This ongoing trend of declining rates supported affordability and encouraged activity among homebuyers. First-time buyers were reminded to get pre-approved through local mortgage loan originators to better understand their purchasing power.
Curious about today’s mortgage rates and the home you can comfortably afford?
Submit a no-obligation mortgage application today and get pre-approved to determine your budget and take the first step toward homeownership with confidence.
Overview of Differences Between the 2010 and 2011 Real Estate Markets in Princeton, Texas
Volume of Sales
2010 saw 176 homes sold, while 2011 recorded a lower total of 139 homes, reflecting a decline in market activity.
Pricing
- Minimum price rose from $12,900 in 2010 to $13,000 in 2011, showing a slight increase.
- Maximum price increased modestly from $515,000 to $550,000, highlighting continuing interest in high-end properties.
- Average price decreased from $115,316 to $106,426, suggesting a softening market.
- Median price fell from $116,950 to $108,000, further indicating a decline in typical home values.
Market Efficiency
- Days on Market (DOM) stretched from an average of 74 days in 2010 to 90 days in 2011, signaling slower sales.
- The ClsPr/LstPr ratio dipped from 97.28% to 95.84%, showing buyers negotiated slightly deeper discounts off the listing price.
- ClsPr/OLP fell from 93.31% to 89.99%, reflecting more significant price adjustments from original listings.
Property Features
- Average square footage remained similar, increasing slightly from 1,816 sqft to 1,846 sqft, while lot size decreased from an average of 0.863 acres to 0.748 acres.
- Homes with pools dropped steeply from 7 in 2010 to only 1 in 2011, indicating reduced luxury demand.
- New construction sales fell from 54 to 34, showing slower activity in this segment.
Economic Context
Mortgage rates dropped from 4.86% in 2010 to 4.65% in 2011, making borrowing slightly more affordable. Despite this, the market saw reduced activity and pricing shifts, possibly due to broader economic influences like higher gas prices (rising from $2.64 to $3.37 per gallon).
This comparison highlights a cooling market in 2011, with fewer transactions, lower average pricing, and slower sales, though high-end properties and value adjustments exhibited unique trends.
Summary of Real Estate Market Analysis for Princeton, TX in 2011
The 2011 real estate market in Princeton, Texas reflected a year of subtle shifts and adjustments, signaling a period of stabilization rather than rapid growth. With a decline in sales volume from 176 homes in 2010 to 139 in 2011, homebuyer activity visibly slowed down. Home values softened slightly, with the average price dropping to $106,426, while the median price settled at $108,000. Despite these decreases, the market continued to showcase diversity, offering options ranging from affordable starter homes priced as low as $13,000 to high-end properties reaching $550,000.
The Importance of Statistical Data in Princeton, Texas Real Estate Market
Did you know that appraisers and Realtors rely on historical statistical data to determine a property’s current value?
Analyzing historical market data is essential for making informed decisions in today’s real estate market. Examining past trends provides valuable insights that facilitate accurate pricing, more strategic negotiations, and a comprehensive understanding of market dynamics. By understanding market dynamics, both homebuyers and home-sellers can leverage the conditions to achieve their goals.
Unlock Exceptional Service!
Assistance with all your real estate needs in the Dallas-Fort Worth area is just a click or call away. Reach out at 214-940-8149 or connect through the links below.

Oleg Sedletsky REALTOR® in Princeton, Texas. Call/Text 214.940.8149
Greetings! I’m Oleg Sedletsky, and I’m excited to introduce myself as your go-to full-time licensed Texas REALTOR® and Mortgage Loan Originator.
I proudly represent JPAR® – Real Estate Brokerage as a REALTOR® and Utopia Mortgage LLC as a Mortgage Loan Originator! My designations and certifications reflect my dedication to helping you achieve your real estate goals in Princeton, TX and other locations in the vibrant Dallas-Fort Worth area!
My commitment to ongoing professional development means I’m always enhancing my skills to serve you better. You can count on me as your trusted expert throughout your real estate journey. Plus, I’m fluent in English, Ukrainian, and Russian and ready to assist you every step of the way!
It’s All About You and Your Real Estate Goals!
My mission is to serve you! With my knowledge and expertise, I’m here to help you achieve all your real estate goals!
I’m passionate about helping buyers and sellers navigate the exciting real estate landscape in Princeton, Texas! Whether you’re searching for your dream home, exploring land options, or looking for commercial properties, my Real Estate Services have you covered.
Contact me today for all your real estate needs in Princeton, Texas! Call/text 214-940-8149

A Comprehensive Analysis of Single-Family Residential Housing Market in Princeton, TX: 2010 to Present
Discover the trends, stats, and insights shaping Princeton’s real estate market year by year!
2010-2020
Princeton, TX Real Estate Market Report 2010: Analysis and Trends
Princeton, TX Real Estate Market Report 2011: Analysis and Trends
Princeton, TX Real Estate Market Report 2012: Analysis and Trends
Princeton, TX Real Estate Market Report 2013: Analysis and Trends
Princeton, TX Real Estate Market Report 2014: Analysis and Trends
Princeton, TX Real Estate Market Report 2015: Analysis and Trends
Princeton, TX Real Estate Market Report 2016: Analysis and Trends
Princeton, TX Real Estate Market Report 2017: Analysis and Trends
Princeton, TX Real Estate Market Report 2018: Analysis and Trends
Princeton, TX Real Estate Market Report 2019: Analysis and Trends
Princeton, TX Real Estate Market Report 2020: Analysis and Trends
This market analysis is intended solely for educational purposes. This market analysis is based on data sourced from NTREIS, Inc. This analysis is exclusively focused on single-family homes and does not account for other property types. The total number of real estate transactions within the specified period and location may vary. Data accuracy cannot be guaranteed due to potential input errors made by NTREIS users. This market analysis does not account for all new construction home sales. If you need detailed information about recorded property sales or other public records, please contact the appropriate city or county office.