
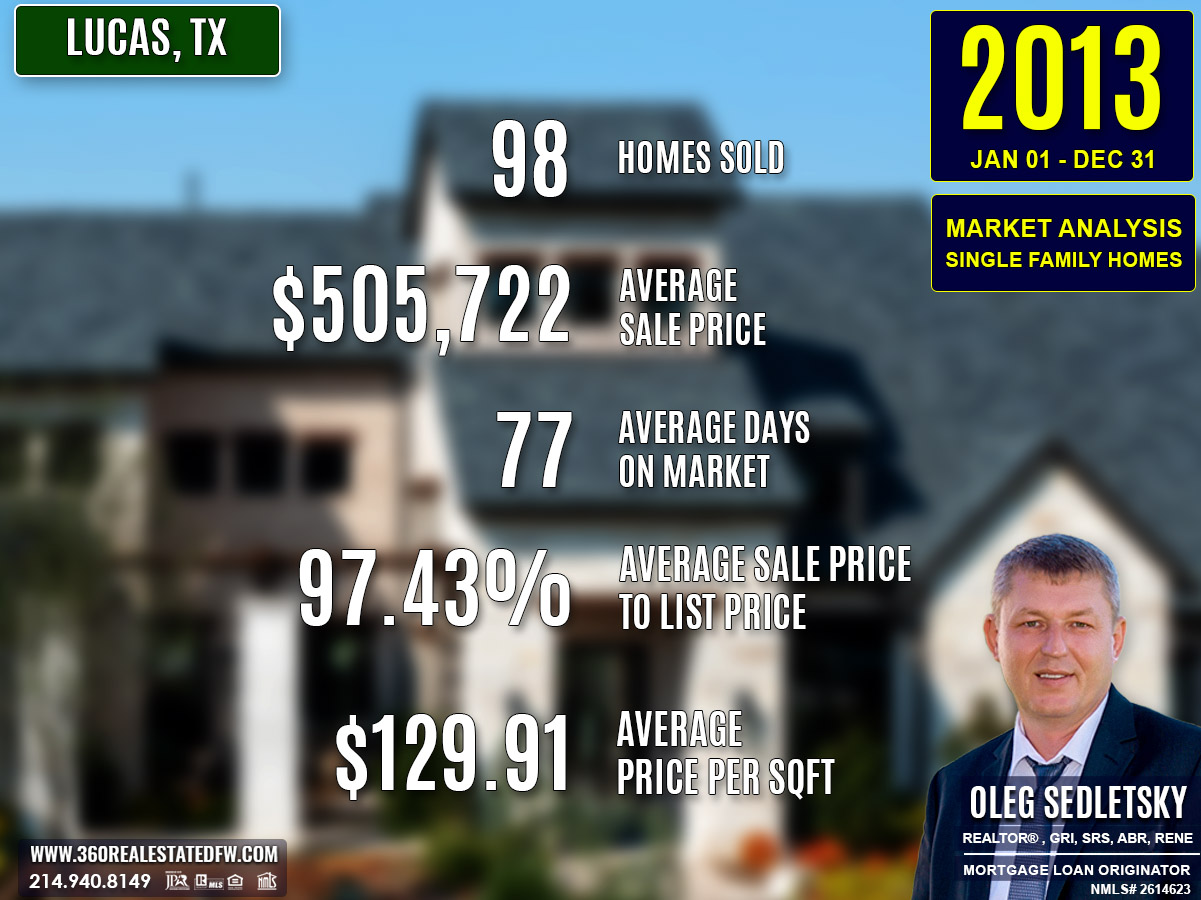
The 2013 real estate market in Lucas, Texas demonstrated consistency and efficiency while catering to diverse buyer preferences. A total of 98 homes closed, matching the previous year’s sales volume, reflecting sustained demand. While high-end estate sales declined, the market leaned toward moderately sized and priced properties, with steady demand for leisure-focused features and efficient transaction timelines.
Key Takeaways and Trends from Lucas’s 2013 Real Estate Market
1. Pricing Range
- The wide pricing range of $93,410 to $949,000 provided entry-level affordability balanced with mid-range exclusivity.
- The average price drop and rise in price per square foot signaled a shift toward valuing smaller but well-finished properties.
2. Market Efficiency
- With an average DOM of 77 days and sellers achieving 97.43% of list prices, the 2013 market became faster and more efficient than the previous year.
- Increased alignment with original listing prices (96.64%) reflected fewer price reductions and closer expectations between buyers and sellers.
3. Unique Outliers
- Pool homes rose to 39, making them increasingly attractive to buyers.
- Lot sizes decreased, with no ultra-expansive estates like 2012’s 73-acre lot; the largest in 2013 measured 14.56 acres.
4. Mortgage Rates Impact
The mortgage rate rise to 4.16%, from 3.88% in 2012, may have tempered luxury sales but proved affordable enough to sustain moderate to mid-tier buyer activity.
Total Homes Closed
During 2013, 98 homes were closed, maintaining steady transaction levels from 2012. Among these, 39 homes featured pools, continuing to highlight buyer interest in leisure amenities. Meanwhile, the market introduced 14 new construction homes, representing a slight decrease from the preceding year but consistent with the demand for updated, modern living spaces.
Property Pricing Insights
Property prices in 2013 highlighted a stable market overall but with a shift away from ultra-luxury transactions seen in the prior year:
- Minimum Price: $93,410, broadening affordability for entry-level buyers.
- Maximum Price: $949,000, a notable decline from the previous year’s $2,000,000 high.
- Average Price: $505,722, slightly lower than the 2012 average but reflective of sustained mid-range transactions.
- Median Price: $507,000, rising slightly from 2012, showing steady demand for mid-tier homes.
- Price per Square Foot (Avg): $129.91, up from $125.00 in 2012, showcasing increased valuation of smaller properties.
Property Size and Features
The 2013 market prioritized diversity and practicality in its property features:
- Bedrooms: Homes ranged from 2 to 7 bedrooms, averaging 4 bedrooms.
- Bathrooms: Properties offered 2 to 7 bathrooms, with an average of 4 bathrooms.
- Square Footage: Size spanned 1,346 sq. ft. to 7,232 sq. ft., averaging 3,886 sq. ft., slightly smaller than the previous year’s properties.
- Lot Sizes: Lots ranged from 0.34 acres to 14.56 acres, with an average of 2.011 acres, reflecting less focus on estate-sized properties compared to 2012.
Market Dynamics
Efficiency and improved pricing strategies defined Lucas’s real estate market in 2013:
- Average Days on Market (DOM): 77 days, shorter than the prior year, suggesting quicker turnovers.
- Median DOM: Homes frequently closed within 45 days, a significant improvement from the 70 days in 2012.
- ClsPr/LstPr Ratio: Sellers achieved 97.43% of listing prices, an efficiency boost from the 96.63% seen in 2012.
- ClsPr/OLP Ratio: Original listing prices aligned with 96.64% of final sale prices, a refinement in negotiation efficiency.
- Price per Square Foot: At $129.91, this indicated increased valuations and tighter ranges.
Insights into the Most Expensive Lucas, TX Property Sold in 2013
The most expensive property sold in Lucas, Texas during 2013 reflected a combination of premium features and exclusivity, despite being more modest compared to previous years. This remarkable home closed at $949,000 and was designed to cater to selective buyers looking for space, comfort, and location. Key details are provided below:
- Price: $949,000
- Beds/Baths: 3 bedrooms, 3 bathrooms (2 full, 1 half)
- Square Footage: 2,602 sq. ft.
- Price per Square Foot: $364.72
- Lot Size: 14.56 acres
- Days on Market (DOM): 248 days
- ClsPr/LstPr Ratio: 95.09%
- ClsPr/OLP Ratio: 95.09%
- Year Built: 1989
This home stood out for the quality it offered on a large lot, making it a significant marker of the 2013 market’s shift toward refined mid-tier luxury.
Economic context
Average Electricity Costs in Dallas-Fort Worth in 2013
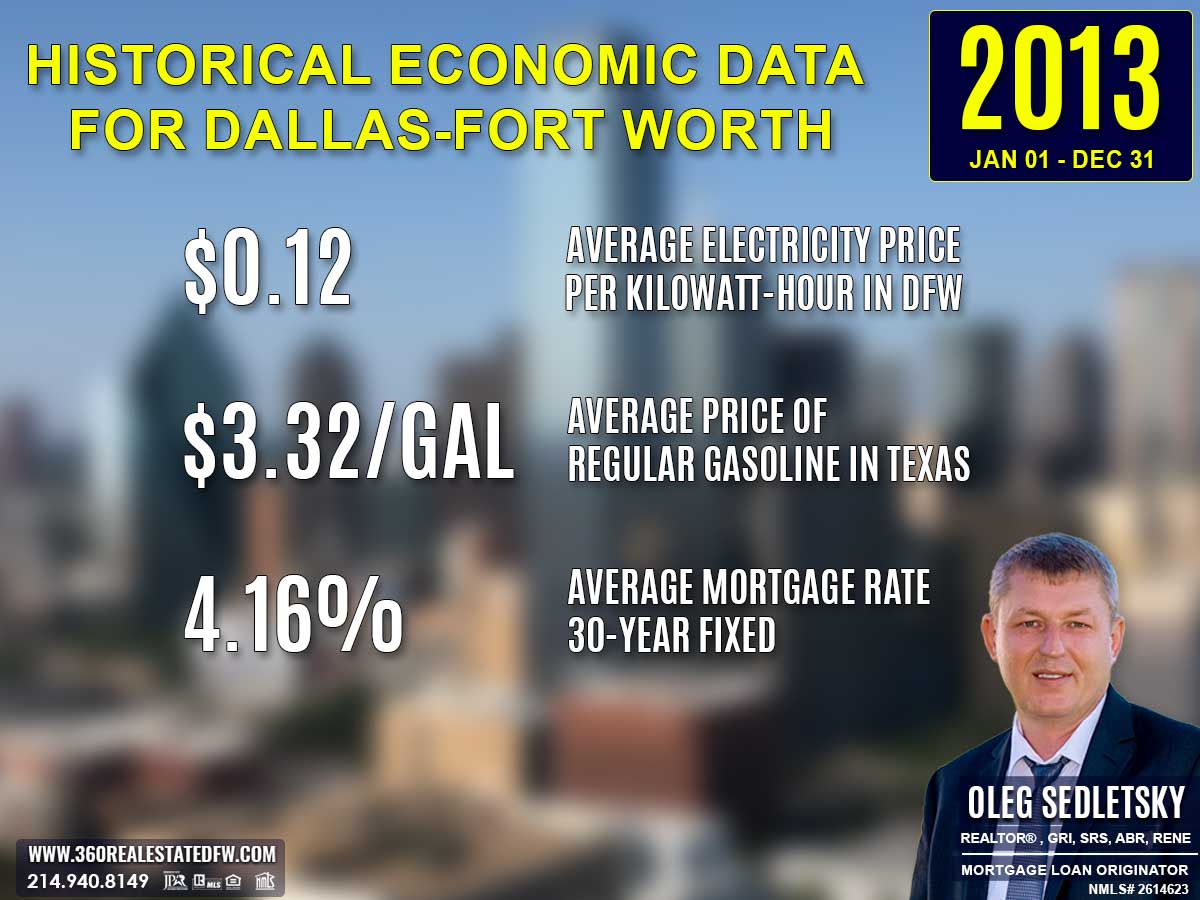
Electricity prices increased to $0.12 per kilowatt-hour in 2013, compared to $0.11 in 2012. This slight rise might have led consumers to reassess their energy usage and consider more energy-efficient homes. Real estate agents likely saw growing interest in properties with features like modern insulation or smart energy systems, which could offset rising utility expenses.
Average Price for Regular Gasoline in Texas in 2013
Gas prices decreased to $3.32 per gallon in 2013, down slightly from $3.42 in 2012. This minor drop helped ease transportation costs for homebuyers. With slightly lower fuel expenses, potential buyers may have been more open to properties in suburban areas, especially if housing prices were more competitive than in urban locations.
Average 30-Year Fixed Mortgage Rate in 2013
Mortgage rates inched up to 4.16% in 2013 from 3.88% in the prior year. While the increase wasn’t drastic, it may have nudged some homebuyers to act sooner rather than later to secure financing. Homebuyers are encouraged to work with local mortgage loan originators to ensure they understand their borrowing capabilities and can lock in competitive rates with ease.
Curious about today’s mortgage rates and the home you can comfortably afford?
Submit a no-obligation mortgage application today and get pre-approved to determine your budget and take the first step toward homeownership with confidence.
Overview of Differences Between the 2012 and 2013 Real Estate Markets in Lucas, Texas
The comparison between Lucas’s real estate markets for 2012 and 2013 showcases a year of stabilization and subtle shifts, highlighting evolving property trends and buyer behavior:
Total Homes Sold
Sales volume remained consistent with 98 homes closed in both 2012 and 2013, suggesting a steady market demand.
Pricing Insights
- The minimum price decreased from $104,000 in 2012 to $93,410 in 2013, broadening entry-level affordability.
- The maximum price dropped significantly to $949,000, compared to $2,000,000 in 2012, indicating fewer ultra-high-end sales in 2013.
- The average price dipped slightly from $511,809 to $505,722, while the median price increased slightly to $507,000, reflecting stability within mid-tier segments.
- The price per square foot rose to $129.91, up from $125.00 in 2012, highlighting a trend of increased valuations despite lower maximum property prices.
Property Features
- Square footage decreased, with the largest home measuring 7,232 sq. ft. (down from 8,700 sq. ft. in 2012).
- The average square footage also dropped slightly to 3,886 sq. ft., reflecting demand for more moderately sized homes.
- Lot sizes became smaller on average, with a maximum of 14.56 acres in 2013, compared to 73 acres in 2012. This likely reflects a reduced emphasis on expansive estate properties.
Market Dynamics
- Days on Market (DOM): Homes sold faster in 2013, taking an average of 77 days, down from 100 days in 2012. The median DOM also improved dramatically to 45 days, signaling quicker transactions.
- ClsPr/LstPr Ratio: Sellers achieved 97.43% of listing prices, up from 96.63% in 2012, demonstrating improved market efficiency.
- ClsPr/OLP Ratio: Original listing price success increased to 96.64%, compared to 93.91% in 2012, highlighting fewer price reductions.
Notable Trends and Outliers
- Pool homes grew in popularity, rising to 39 in 2013, up from 36 the previous year, pointing to sustained demand for leisure amenities.
- New construction homes decreased slightly, with 14 builds in 2013, compared to 15 in 2012, continuing the trend of fewer, more specific developments.
- The most expensive property sold in 2013 was a $949,000 home on 14.56 acres, a significant shift from the luxury estate market’s $2,000,000 sale in 2012.
Economic Context
The mortgage rates increased slightly to 4.16%, up from 3.88% in 2012, potentially tempering higher-end market activity while maintaining overall market balance.
External cost factors, like a slight decrease in gas prices to $3.32, may have encouraged a shift in buyer preferences towards homes with moderate acreage and better proximity to conveniences.
Key Takeaway
The 2013 real estate market in Lucas, TX reflected a year of steadiness, marked by stabilized sales volumes, improving transaction efficiency, and rising property valuations. A shift away from large luxury estates to more moderately sized and priced homes highlighted changing preferences, while increasing demand for pool homes and efficient pricing strategies kept the market dynamic and appealing.
Summary of Real Estate Market Analysis for Lucas, TX in 2013
The 2013 real estate market in Lucas, Texas reflected a well-balanced and efficiently operating market, marked by consistent sales volume and evolving buyer preferences. Catering to a wide array of demands, the market provided opportunities for entry-level buyers through affordable pricing while also supporting mid-tier transactions with steady median values.
The presence of leisure amenities like pools and the trend toward practical, moderately-sized properties demonstrated the market’s adaptability to shifting priorities. Improving transaction efficiency, coupled with rising price per square foot valuations, further supported a healthy and dynamic market. Lucas’s ability to combine stability with diversity and growing demand underlines its continued appeal and potential for future resilience.
The Importance of Statistical Data in Lucas, Texas Real Estate Market
Did you know that appraisers and Realtors rely on historical statistical data to determine a property’s current value?
Analyzing historical market data is essential for making informed decisions in today’s real estate market. Examining past trends provides valuable insights that facilitate accurate pricing, more strategic negotiations, and a comprehensive understanding of market dynamics.
Unlock Exceptional Service!
Assistance with all your real estate needs in the Dallas-Fort Worth area is just a click or call away. Reach out at 214-940-8149 or connect through the links below.

Oleg Sedletsky REALTOR® in Lucas, Texas. Call/Text 214.940.8149
Greetings! I’m Oleg Sedletsky, and I’m excited to introduce myself as your go-to full-time licensed Texas REALTOR® and Mortgage Loan Originator.
I proudly represent JPAR® – Real Estate Brokerage as a REALTOR® and Utopia Mortgage LLC as a Mortgage Loan Originator! My designations and certifications reflect my dedication to helping you achieve your real estate goals in Lucas, TX and other locations in the vibrant Dallas-Fort Worth area!
My commitment to ongoing professional development means I’m always enhancing my skills to serve you better. You can count on me as your trusted expert throughout your real estate journey. Plus, I’m fluent in English, Ukrainian, and Russian and ready to assist you every step of the way!
It’s All About You and Your Real Estate Goals!
My mission is to serve you! With my knowledge and expertise, I’m here to help you achieve all your real estate goals!
I’m passionate about helping buyers and sellers navigate the exciting real estate landscape in Lucas, Texas! Whether you’re searching for your dream home, exploring land options, or looking for commercial properties, my Real Estate Services have you covered.
Contact me today for all your real estate needs in Lucas, Texas! Call/text 214-940-8149

A Comprehensive Analysis of Single-Family Residential Housing Market in Lucas, TX: 2003 to Present
2003-2010
Lucas, TX Real Estate Market Report 2003: Analysis and Trends
Lucas, TX Real Estate Market Report 2004: Analysis and Trends
Lucas, TX Real Estate Market Report 2005: Analysis and Trends
Lucas, TX Real Estate Market Report 2006: Analysis and Trends
Lucas, TX Real Estate Market Report 2007: Analysis and Trends
Lucas, TX Real Estate Market Report 2008: Analysis and Trends
Lucas, TX Real Estate Market Report 2009: Analysis and Trends
Lucas, TX Real Estate Market Report 2010: Analysis and Trends
2011-2020
Lucas, TX Real Estate Market Report 2011: Analysis and Trends
Lucas, TX Real Estate Market Report 2012: Analysis and Trends
Lucas, TX Real Estate Market Report 2013: Analysis and Trends
Lucas, TX Real Estate Market Report 2014: Analysis and Trends
Lucas, TX Real Estate Market Report 2015: Analysis and Trends
Lucas, TX Real Estate Market Report 2016: Analysis and Trends
Lucas, TX Real Estate Market Report 2017: Analysis and Trends
Lucas, TX Real Estate Market Report 2018: Analysis and Trends
Lucas, TX Real Estate Market Report 2019: Analysis and Trends
Lucas, TX Real Estate Market Report 2020: Analysis and Trends
This market analysis is intended solely for educational purposes. This market analysis is based on data sourced from NTREIS, Inc. This analysis is exclusively focused on single-family homes and does not account for other property types. The total number of real estate transactions within the specified period and location may vary. This market analysis does not account for all new construction home sales. If you need detailed information about recorded property sales or other public records, please contact the appropriate city or county office.