
The 2021 real estate market in Blue Ridge, TX continued to thrive despite the ongoing challenges of the second year of COVID-19.
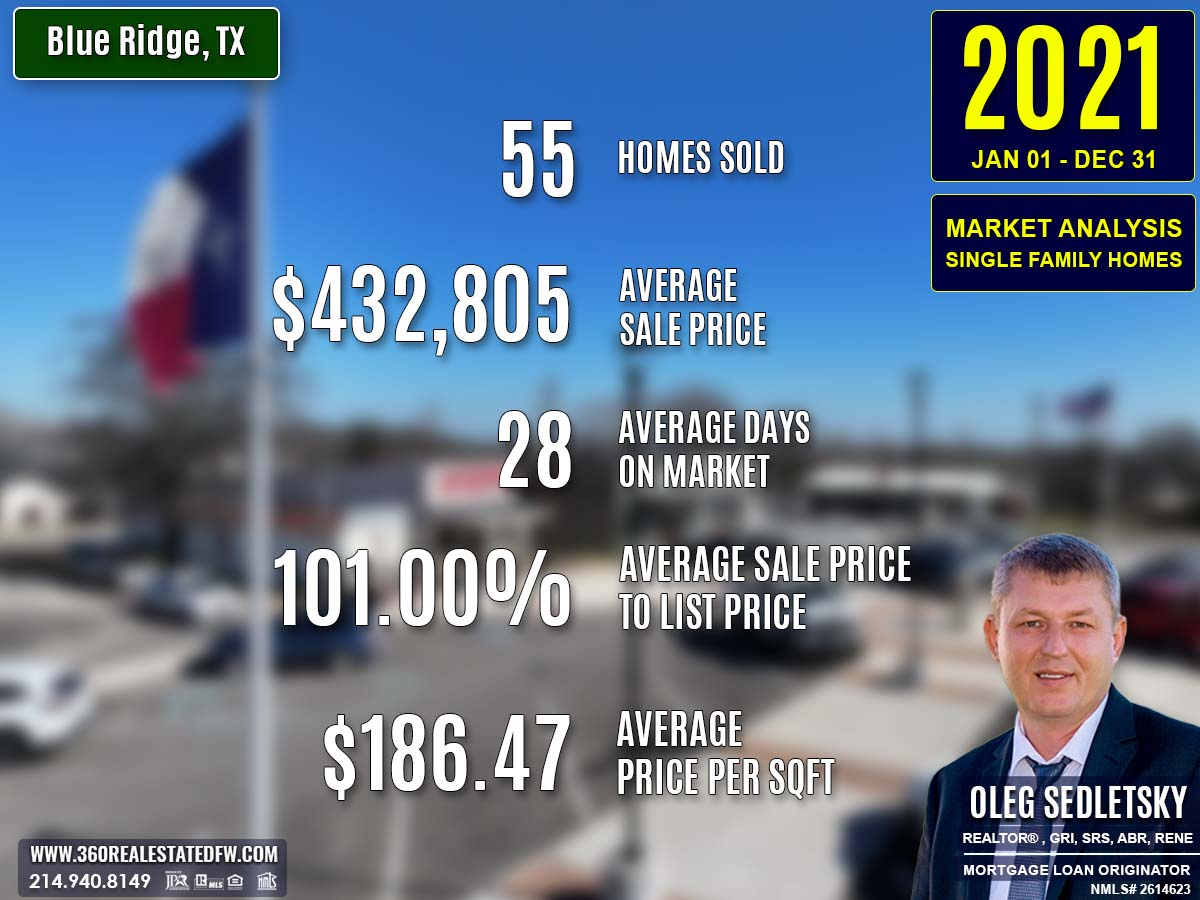
The market demonstrated remarkable growth and increased activity, with 55 homes closed—the highest total in recent years. This year highlighted skyrocketing property values, improved market dynamics, and greater buyer confidence driven by evolving preferences shaped by the pandemic.
Key Takeaways and Trends from Blue Ridge’s 2021 Real Estate Market
Pricing Range: Prices spanned from $86,116 to $1,650,000, with a significant boost in luxury property values driving market activity upward.
Market Efficiency: Shortened average DOM, higher close-to-list ratios, and competitive price-per-square-foot metrics reflect a seller’s market with intense buyer interest.
Unique Outliers: The explosive rise in maximum price and $405/sq. ft. profile of the most expensive property signals growing demand for well-designed, luxury homes in Blue Ridge, Texas.
Total Homes Closed
Blue Ridge’s real estate sector saw 55 single-family homes close in 2021, a significant increase from 41 homes in 2020. This rise in transactions underscores a robust increase in market activity and demand for properties amidst shifting lifestyle preferences during the ongoing pandemic.
Property Pricing Insights
The pricing landscape in 2021 showcased robust growth, especially in the luxury segment:
- Minimum Price: Increased to $86,116, indicating higher entry-level home valuations.
- Maximum Price: Surged to a staggering $1,650,000, more than doubling the highest price of 2020, signaling strong demand for high-end properties.
- Average Price: Rose to $432,805, up from $334,746 in 2020, highlighting steady growth in property values.
- Median Price: Increased to $396,900, illustrating sustained strength in the mid-market segment.
Property Size and Features
Bedrooms and Bathrooms
- Bedrooms: Most homes featured 4 bedrooms, meeting family lifestyle requirements.
- Bathrooms: Properties averaged 3 bathrooms, maintaining a balance between convenience and functionality.
Square Footage
- Minimum Size: Expanded slightly to 900 sq. ft. from 888 sq. ft. in 2020, offering slightly larger options for entry-level buyers.
- Maximum Size: Decreased marginally to 4,253 sq. ft. from 4,438 sq. ft., indicating a small shift in ultra-large luxury homes.
- Average Size: Declined to 2,343 sq. ft., from 2,391 sq. ft., reflecting efficient use of space without compromising functionality.
- Median Size: Dropped to 2,080 sq. ft., down from 2,425 sq. ft., showcasing a preference for mid-sized, more manageable homes.
Lot Size
- Minimum Lot Size: Declined to 0.178 acres, down from 0.254 acres, reflecting denser development.
- Maximum Lot Size: Increased to 34.200 acres, from 30.109 acres, catering to buyers seeking expansive outdoor properties.
- Average Lot Size: Rose to 3.949 acres, reinforcing the growing importance of outdoor spaces in the COVID-19 era.
Market Dynamics
Days on Market (DOM)
- Minimum DOM: Dropped sharply to just 1 day, highlighting intense competition for desirable listings.
- Maximum DOM: Halved to 147 days, compared to 277 days in 2020, showing a significant reduction in high-end transaction timelines.
- Average DOM: Reduced significantly to 28 days from 81 days, reflecting a fast-paced market driven by high buyer demand.
Price Ratios
- ClsPr/LstPr (Close Price to Listing Price): Reached an impressive 101%, showing that properties often sold above asking price.
- ClsPr/OLP (Close Price to Original Listing Price): Increased to 99.60%, narrowing negotiation margins.
Price Per Square Foot
- Pr$/SqFt: Skyrocketed to $186.47, up from $143.29 in 2020, illustrating the rapid rise in valuations.
Insights into the Most Expensive Blue Ridge, TX Property Sold in 2021
The most expensive property sold in 2021 was a testament to the market’s luxury growth.
Key Details:
- Price: $1,650,000
- Bedrooms: 3
- Bathrooms: 3 (2 full, 1 half)
- Square Footage: 4,074 sq. ft.
- Price Per Square Foot: $405.01
- Lot Size: 20 acres
- Days on Market (DOM): 12 days
- ClsPr/LstPr Ratio: 92.18%
- Year Built: 2018
This property exemplified high-end living with its expansive interior, premium outdoor space, and impressive build quality.
Economic context
Average Electricity Costs in Dallas-Fort Worth in 2021
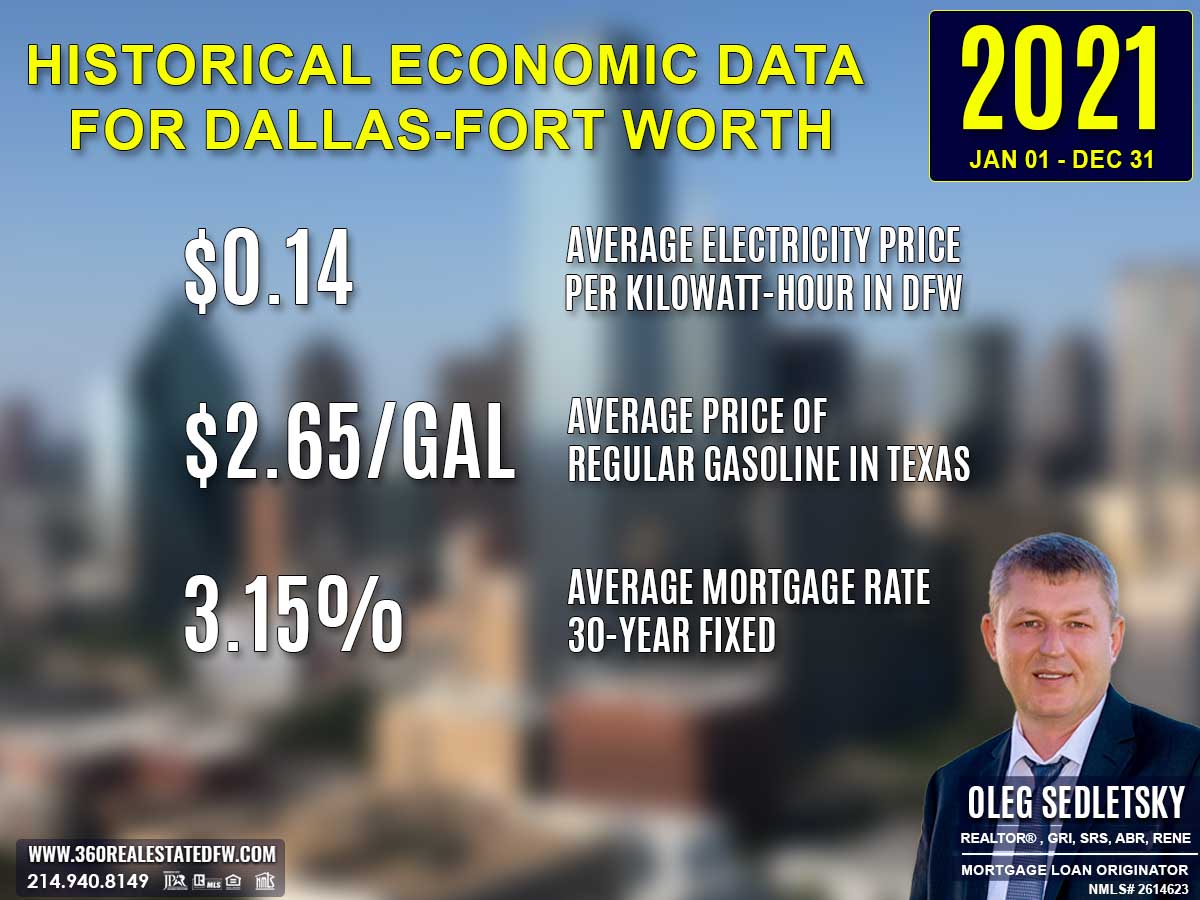
The average electricity cost rose slightly to $0.14 per kWh, reflecting general inflation in utility expenses.
Texas Average Gas Prices in 2021
Average gas prices jumped to $2.65 per gallon from $1.82 in 2020, increasing transportation and heating costs for homeowners.
Average 30-Year Fixed Mortgage Rate in 2021
The average 30-year fixed mortgage rate in 2021 dropped slightly to 3.15%, continuing to boost affordability for homebuyers. This marginal decline from the previous year’s rates encouraged many to take advantage of lower financing costs, enabling greater purchasing power and the ability to secure higher-value homes. HomeBuyers capitalized on this favorable environment, helping sustain strong demand in the market, even amid the uncertainties of the second year of the pandemic.
Curious about today’s mortgage rates and the home you can comfortably afford?
Submit a no-obligation mortgage application today and get pre-approved to determine your budget and take the first step toward homeownership with confidence.
Summary of Differences Between 2020 and 2021 Real Estate Data for Blue Ridge, TX
The comparison between 2021 and 2020 real estate data for Blue Ridge, Texas underscores significant growth and an increasingly competitive market in 2021. Below are the key differences:
Property Pricing
- Minimum Price: Increased substantially to $86,116 from $61,300 in 2020, indicating a higher entry point for buyers.
- Maximum Price: More than doubled to $1,650,000 from $695,000, showcasing an extraordinary boost in the luxury segment.
- Average Price: Rose sharply to $432,805 from $334,746, reflecting robust demand across higher-priced homes.
- Median Price: Jumped to $396,900 from $359,000, signifying a steady rise in mid-market values.
Property Features
- Bedrooms and Bathrooms: Remained consistent on average at 4 bedrooms and 3 bathrooms in both years; no major shifts in these key features.
- Square Footage:
- Minimum slightly expanded to 900 sq. ft. from 888 sq. ft., offering larger entry-level homes.
- Maximum decreased to 4,253 sq. ft. from 4,438 sq. ft., reflecting a modest reduction in the largest homes sold.
- Average contracted slightly to 2,343 sq. ft., down from 2,391 sq. ft., aligning with buyer preferences for practical spaces.
- Median size declined more notably to 2,080 sq. ft., down from 2,425 sq. ft., reinforcing the shift toward more mid-sized properties.
Lot Size
- Minimum Lot Size: Decreased to 0.178 acres from 0.254 acres, suggesting slightly denser property developments.
- Maximum Lot Size: Increased from 30.109 acres to 34.200 acres, offering larger plots for premium homes.
- Average Lot Size: Increased significantly to 3.949 acres from 3.571 acres, illustrating a greater emphasis on outdoor living spaces.
Market Dynamics
-
Days on Market (DOM):
- Minimum DOM: Dropped dramatically to 1 day from 3 days, highlighting intense competition and faster sales for desirable properties.
- Maximum DOM: Shortened substantially to 147 days from 277 days, reflecting faster turnover even for high-end homes.
- Average DOM: Plummeted to 28 days from 81 days, signaling a significantly more efficient market.
-
ClsPr/LstPr Ratio: Increased to a stellar 101% from 96.95%, illustrating a highly competitive seller’s market where many properties closed above asking price.
-
ClsPr/OLP Ratio: Improved to 99.60% from 95.06%, showcasing reduced negotiation gaps and firmer list prices.
-
Price Per Square Foot (Pr$/SqFt): Skyrocketed from $143.29 to $186.47, underscoring a sharp rise in the valuation of every square foot of property.
Year Built
- Oldest Property Built: Remained steady at 1945 in both years.
- Newest Property Built: Shifted to 2021 from 2020, reflecting the addition of new constructions entering the market.
- Average Year Built: Increased to 2003 from 2001, indicating a younger overall housing inventory.
- Median Year Built: Advanced to 2006 from 2015, highlighting the growing availability of newer homes.
Key Trends and Insights
- Luxury Surge: A standout increase in maximum price and price per square foot signals explosive growth in the luxury market, with buyers willing to invest in high-end properties.
- Market Efficiency: Tighter DOM, higher close-to-list price ratios, and faster sales cycles underline an exceptionally streamlined and competitive market environment.
- Mid-Tier Preference: A slight contraction in square footage and median lot size reflects buyer inclination toward manageable, well-sized homes alongside a demand for outdoor space.
The 2021 market in Blue Ridge, TX demonstrated higher competition, quicker sales, and expanding luxury opportunities, building on the foundation set in 2020.
Summary of Real Estate Market Analysis for Blue Ridge, TX in 2021
The 2021 real estate market in Blue Ridge, TX, showcased remarkable growth and resilience, achieving its highest level of activity in recent years with 55 homes closed. This surge highlights the adaptability of the market, driven by competitive pricing, high demand, and efficient transactions. Increased property values, particularly in the luxury segment, and a rise in median home prices to $396,900 underscored the market’s ongoing strength across all tiers.
The second year of the COVID-19 pandemic played a pivotal role in shaping homebuyer preferences, leading to a strong demand for homes with larger lot sizes, functional layouts, and outdoor spaces. These trends signified the growing importance of flexibility and comfort as remote work and at-home living continued.
For home-sellers, the market presented a golden opportunity; higher close-to-list price ratios and shorter average days on the market ensured seamless, profitable transactions. On the other hand, homebuyers capitalized on historically low mortgage rates of 3.15%, enabling them to secure dream properties amid rising prices.
Blue Ridge’s real estate market in 2021 exemplified adaptability, efficiency, and its ability to meet evolving buyer needs, setting the stage for further innovation and success in the coming years.
Why Statistics Data is Important
Understanding past market data is essential for making informed decisions in today’s real estate landscape. Historical statistics provide a foundational perspective on trends, aiding in fair pricing and negotiation.
Unlock Exceptional Service!
Assistance with all your real estate needs in the Dallas-Fort Worth area is just a click or call away. Reach out at 214-940-8149 or connect through the links below.

Oleg Sedletsky REALTOR® in Blue Ridge, Texas. Call/Text 214.940.8149
Greetings! I’m Oleg Sedletsky, and I’m excited to introduce myself as your go-to full-time licensed Texas REALTOR® and Mortgage Loan Originator.
I proudly represent JPAR® – Real Estate Brokerage as a REALTOR® and Utopia Mortgage LLC as a Mortgage Loan Originator! My designations and certifications reflect my dedication to helping you achieve your real estate goals in Blue Ridge, TX and other locations in the vibrant Dallas-Fort Worth area!
My commitment to ongoing professional development means I’m always enhancing my skills to serve you better. You can count on me as your trusted expert throughout your real estate journey. Plus, I’m fluent in English, Ukrainian, and Russian and ready to assist you every step of the way!
It’s All About You and Your Real Estate Dreams!
My mission is to serve you! With my knowledge and expertise, I’m here to help you achieve all your real estate goals and turn your dreams into reality!
I’m passionate about helping buyers and sellers navigate the exciting real estate landscape in Blue Ridge, Texas! Whether you’re searching for your dream home, exploring land options, or looking for commercial properties, my Real Estate Services have you covered.
Contact me today for all your real estate needs in Blue Ridge, Texas! Call/text 214-940-8149

Discover Yearly Real Estate Market Trends for Blue Ridge, TX
2003-2010
Blue Ridge, TX Real Estate Market in 2003
Blue Ridge, TX Real Estate Market in 2004
Blue Ridge, TX Real Estate Market in 2005
Blue Ridge, TX Real Estate Market in 2006
Blue Ridge, TX Real Estate Market in 2007
Blue Ridge, TX Real Estate Market in 2008
2011-2020
Blue Ridge, TX Real Estate Market in 2011
Blue Ridge, TX Real Estate Market in 2012
Blue Ridge, TX Real Estate Market in 2013
Blue Ridge, TX Real Estate Market in 2014
Blue Ridge, TX Real Estate Market in 2015
Blue Ridge, TX Real Estate Market in 2016
Blue Ridge, TX Real Estate Market in 2017
Blue Ridge, TX Real Estate Market in 2018
This market analysis is intended solely for educational purposes. This market analysis is based on data sourced from NTREIS, Inc. This analysis is exclusively focused on single-family homes and does not account for other property types. The total number of real estate transactions within the specified period and location may vary. Data accuracy cannot be guaranteed due to potential input errors made by NTREIS users. This market analysis does not account for all new construction home sales. If you need detailed information about recorded property sales or other public records, please contact the appropriate city or county office.