
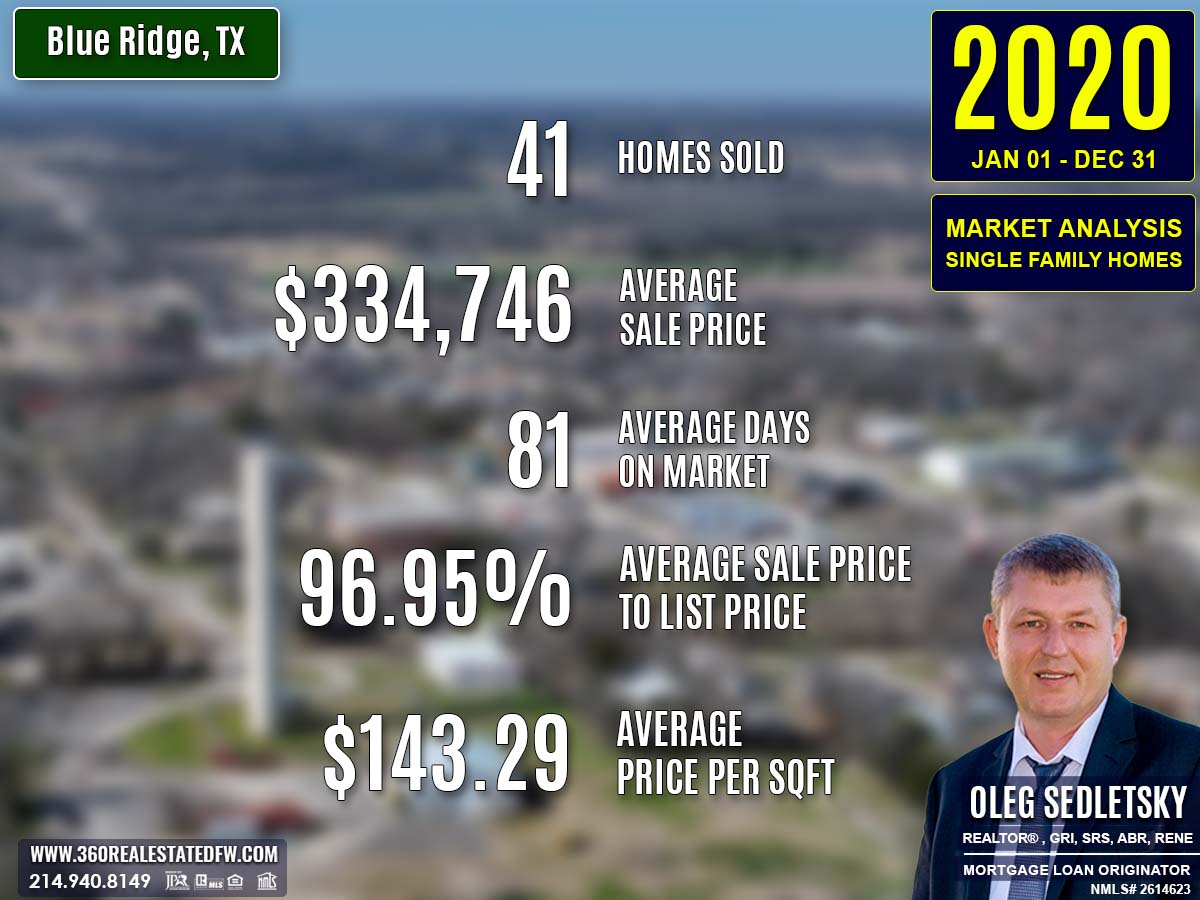
The 2020 real estate market in Blue Ridge, TX demonstrated remarkable resilience and adaptability despite the challenges posed by the COVID-19 pandemic. With 41 homes sold during the year, both buyers and sellers displayed continued confidence in the housing market. The year was characterized by significant growth in the luxury segment, along with rising property valuations and enhanced market efficiency.
The pandemic created shifts in consumer priorities, with many individuals seeking homes that offered more space and comfort to accommodate remote work and lifestyle changes. Additionally, historically low mortgage rates and a diverse range of property offerings contributed to making 2020 a surprisingly dynamic and resourceful year for Blue Ridge’s real estate sector, even amidst unprecedented global uncertainty.
Key Takeaways and Trends from Blue Ridge’s 2020 Real Estate Market
Pricing Range: The rise in maximum price to $695,000 was a notable indicator of revitalized interest in premium homes. However, the minimum price drop to $61,300 maintained the inclusivity of the Blue Ridge, TX housing market.
Market Efficiency: Improved close price ratios and a reduction in maximum DOM demonstrated smoother transactions and better expectations alignment between buyers and sellers.
Unique Outliers: Larger-than-average lots and increasing price-per-square-foot suggested a growing preference for quality acreage and premium materials.
Total Homes Closed
A total of 41 residential single-family homes were sold in 2020, reflecting sustained buyer interest in the local market despite a slight decline from 2019’s total of 45 homes closed. This stability exemplifies the strong demand even during a period of global uncertainties.
Property Pricing Insights
The pricing trends in 2020 emphasized growth in mid-to-high tiers of the market:
- Minimum Price: Decreased to $61,300, offering affordable entry-level opportunities.
- Maximum Price: Jumped to $695,000, highlighting increased activity in premium properties.
- Average Price: Rose to $334,746 from $307,110 in 2019, showcasing increased buyer willingness to invest in higher-value homes.
- Median Price: Climbed to $359,000, up from $340,000 in 2019, demonstrating a robust mid-market segment.
Property Size and Features
Bedrooms and Bathrooms
- Bedrooms: Homes ranged from 2 to 5 bedrooms, with an average of 4 bedrooms, consistent with 2019 trends.
- Bathrooms: Properties offered up to 6 baths, with an average of 3, maintaining a comfortable mix for families and individuals.
Square Footage
- Minimum Size: Slightly declined to 888 sq. ft., reflecting smaller housing options at the entry level.
- Maximum Size: Decreased to 4,438 sq. ft., from 5,620 sq. ft., revealing a shift toward more manageable spaces in the high-end range.
- Average Size: Marginally decreased to 2,391 sq. ft., down from 2,465 sq. ft. in 2019.
- Median Size: Increased to 2,425 sq. ft., up from 2,316 sq. ft., showing greater demand for spacious mid-market properties.
Lot Size
- Minimum Lot Size: Increased to 0.254 acres, from 0.130 acres, offering more expansive properties at the lower end.
- Maximum Lot Size: Fell to 30.109 acres, down from 33.260 acres, indicating a narrowing in ultra-large lot availability.
- Average Lot Size: Rose to 3.571 acres, signaling a preference for larger-than-average properties.
Market Dynamics
Days on Market (DOM)
- Minimum DOM: Increased to 3 days from 2 days in 2019, indicating slightly slowed sales efficiency for the fastest-moving listings.
- Maximum DOM: Reduced to 277 days, from 399 days, showcasing more efficient high-tier transactions.
- Average DOM: Remained stable at 81 days, consistent with 2019’s pace.
Close Price Ratios
- ClsPr/LstPr (Close Price to Listing Price): Improved to 96.95%, up from 96.16% in 2019, reflecting stronger alignment between initial listings and final sale prices.
- ClsPr/OLP (Close Price to Original Listing Price): Increased to 95.06%, compared to 94.23% in 2019, underscoring reduced negotiation margins.
Price Per Square Foot
- Pr$/SqFt (Price Per Square Foot): Rose to $143.29, up from $127.87 in 2019, signaling elevated valuations for property scale and location.
Insights into the Most Expensive Blue Ridge, TX Property Sold in 2020
A standout feature of 2020 was the sale of the year’s most expensive property. This high-value estate reflected the growing upper-tier demand even in a competitive market climate.
Key Highlights:
- Price: $695,000
- Bedrooms: 3
- Bathrooms: 3 (all full baths)
- Square Footage: 4,438 sq. ft.
- Price Per Square Foot: $156.60
- Lot Size: 30.109 acres
- Days on Market: 254 days
- ClsPr/LstPr Ratio: 92.67%
- ClsPr/OLP Ratio: 92.67%
- Year Built: 1996
This property exemplified luxury with its large living space and expansive lot, though its extended time on the market highlighted the challenges of selling high-end properties.
Economic context
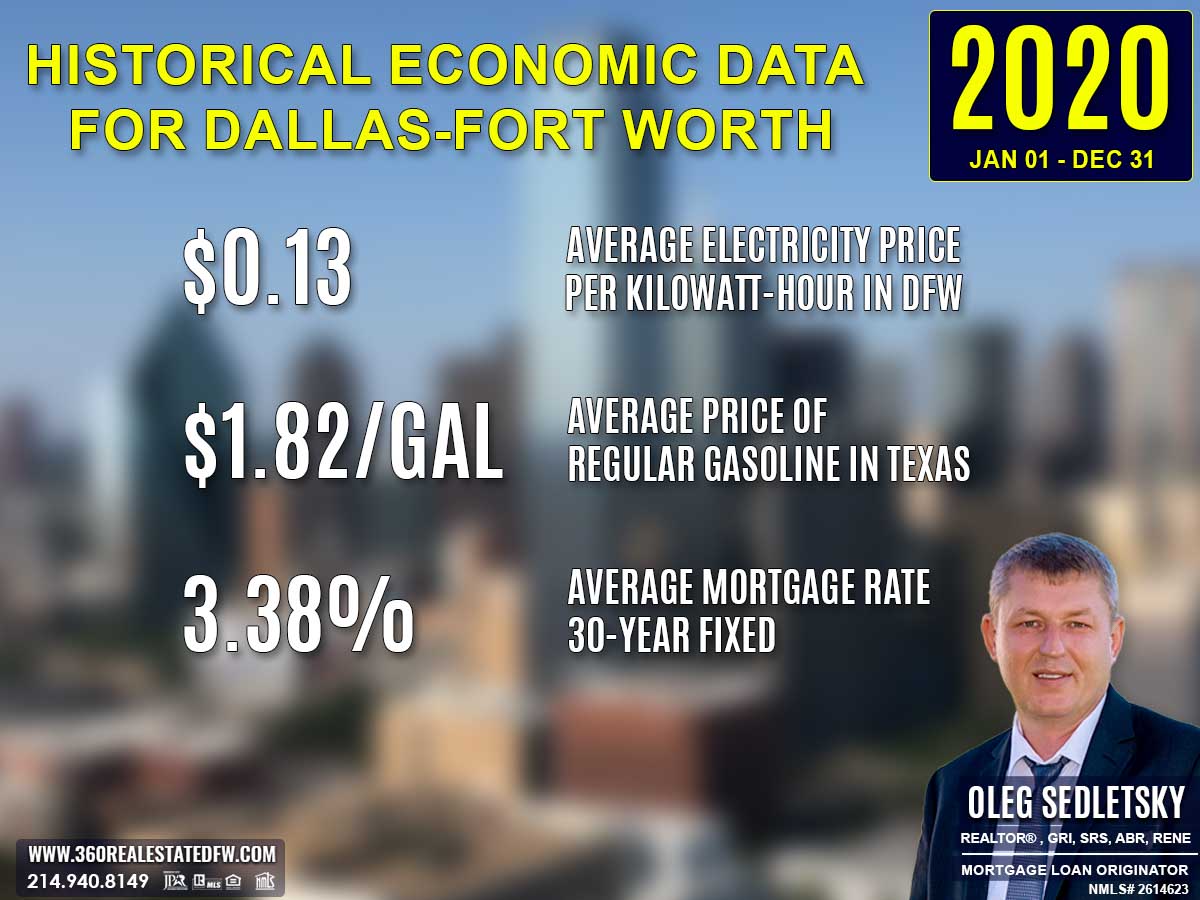
Average Electricity Costs in Dallas-Fort Worth in 2020
The average electricity cost per kilowatt-hour decreased slightly to $0.13, down from $0.14 in 2019. This drop provided homeowners with modest savings on utility expenses.
Texas Average Gas Prices in 2020
Average gas prices dropped significantly to $1.82 per gallon, compared to $2.29 in 2019. This reduction likely eased transportation costs for residents substantially.
Average 30-Year Fixed Mortgage Rate in 2020
The average 30-year fixed mortgage rate in 2020 dropped to 3.38%, a significant reduction compared to the 4.13% rate from the previous year. This decline in rates made home financing more affordable, allowing homebuyers to stretch their budgets and qualify for larger home loans. Lower borrowing costs were especially important during a year marked by economic uncertainties, helping to sustain activity in the housing market and offering buyers a rare opportunity to secure favorable terms.
Curious about today’s mortgage rates and the home you can comfortably afford?
Submit a no-obligation mortgage application today and get pre-approved to determine your budget and take the first step toward homeownership with confidence.
Summary of Differences Between 2019 and 2020 Real Estate Data for Blue Ridge, TX
The 2020 real estate market in Blue Ridge, TX revealed a mix of rising property values, slight changes in property features, and improvements in market efficiency compared to 2019. Key differences are detailed below:
Property Pricing
- Minimum Price: Fell to $61,300 from $70,000 in 2019, indicating more affordable entry-level options.
- Maximum Price: Surged to $695,000, up from $508,474, highlighting renewed activity in the luxury segment.
- Average Price: Increased to $334,746 from $307,110, marking stronger mid-to-high-market demand.
- Median Price: Grew to $359,000 from $340,000, signaling continued upward momentum in mid-market homes.
Property Features
- Bedrooms: Minimum beds increased to 2 from 1 in 2019, while average and maximum beds remained steady at 4 and 5 respectively.
- Bathrooms: Maximum baths rose to 6, up from 7 in 2019. Average baths stayed unchanged at 3 bathrooms per home.
- Square Footage:
- Minimum Size: Slightly decreased to 888 sq. ft. from 900 sq. ft., offering smaller housing options.
- Maximum Size: Decreased to 4,438 sq. ft., down from 5,620 sq. ft., reflecting a narrower high-end range.
- Average Size: Declined modestly to 2,391 sq. ft., from 2,465 sq. ft., demonstrating a marginal contraction in space.
- Median Size: Grew to 2,425 sq. ft., compared to the previous year’s 2,316 sq. ft., reinforcing mid-range property appeal.
Lot Size
- Minimum Lot Size: Increased to 0.254 acres from 0.130 acres, indicating slightly larger entry-level plots.
- Maximum Lot Size: Declined to 30.109 acres, from 33.260 acres, suggesting more manageable high-end land sizes.
- Average Lot Size: Rose to 3.571 acres, up from 2.992 acres, reflecting generally larger lots across the board.
Market Dynamics
-
Days on Market (DOM):
- Minimum DOM: Increased to 3 days from just 2 in 2019, showing slightly less rapid turnaround for the quickest sales.
- Maximum DOM: Dropped to 277 days, down from 399 days, reflecting shorter sale timelines at the higher end.
- Average DOM: Remained stable at 81 days, consistent with last year’s pace.
-
ClsPr/LstPr Ratio: Improved to 96.95%, up from 96.16%, showing better alignment between listing and closing prices.
-
ClsPr/OLP Ratio: Increased to 95.06%, compared to 94.23%, signaling reduced negotiation gaps and firmer seller control.
-
Price Per Square Foot: Rose to $143.29, up from $127.87, indicating higher unit values per square foot.
Year Built
- Oldest Property Built: Shifted forward to properties built in 1945, compared to 1910 in 2019.
- Newest Property Built: Remained consistent at 2020, showcasing new construction activity.
- Average Year Built: Moved forward to 2001 from 1999, reflecting a younger inventory overall.
- Median Year Built: Increased to 2015, from 2012, hinting at more recent housing stock for mid-market buyers.
Key Market Trends
- Luxury Home Growth: An increase in the maximum price, alongside higher square footage pricing, suggests rising demand for premium homes despite slightly smaller high-end properties.
- Improved Efficiency: Stronger close price ratios and a decline in maximum DOM indicate improved transaction processes and buyer confidence.
- Mid-Market Strength: Rising median prices and lot sizes reinforced growth in the mid-tier market, balancing premiums with affordability.
The 2020 market displayed resilience and growth, adapting to shifting buyer preferences while balancing affordability with high-end demand. It maintained stability in pace and efficiency while showcasing new opportunities across market segments.
Summary of Real Estate Market Analysis for Blue Ridge, TX in 2020
The 2020 real estate market in Blue Ridge, TX exemplified resilience and adaptability during an unprecedented year marked by the global COVID-19 pandemic. The market maintained a steady performance, with 41 homes closed, and saw notable growth in property values, particularly in the mid-to-high-tier segments. HomeBuyers, galvanized by historically low mortgage rates of 3.38%, sought properties that offered larger square footage, enhanced outdoor spaces, and features that suited a work-from-home lifestyle. Home Sellers benefited from firmer close price ratios, improved market efficiency, and sustained demand across all price points.
Key trends, such as rising property valuations and increasing per-square-foot prices of $143.29, demonstrated confidence in the market’s growth potential. While the pandemic temporarily affected economic conditions, the real estate sector adapted quickly, with buyers prioritizing lifestyle-oriented features and sellers optimizing returns through efficient transactions.
Ultimately, amidst uncertainties, the Blue Ridge, TX real estate market proved dynamic and robust, paving the way for future growth and innovation in housing solutions. Both buyers and sellers benefited from an environment defined by opportunity, flexibility, and resilience.
Why Statistics Data is Important
Understanding past market data is essential for making informed decisions in today’s real estate landscape. Historical statistics provide a foundational perspective on trends, aiding in fair pricing and negotiation.
Unlock Exceptional Service!
Assistance with all your real estate needs in the Dallas-Fort Worth area is just a click or call away. Reach out at 214-940-8149 or connect through the links below.

Oleg Sedletsky REALTOR® in Blue Ridge, Texas. Call/Text 214.940.8149
Greetings! I’m Oleg Sedletsky, and I’m excited to introduce myself as your go-to full-time licensed Texas REALTOR® and Mortgage Loan Originator.
I proudly represent JPAR® – Real Estate Brokerage as a REALTOR® and Utopia Mortgage LLC as a Mortgage Loan Originator! My designations and certifications reflect my dedication to helping you achieve your real estate goals in Blue Ridge, TX and other locations in the vibrant Dallas-Fort Worth area!
My commitment to ongoing professional development means I’m always enhancing my skills to serve you better. You can count on me as your trusted expert throughout your real estate journey. Plus, I’m fluent in English, Ukrainian, and Russian and ready to assist you every step of the way!
It’s All About You and Your Real Estate Dreams!
My mission is to serve you! With my knowledge and expertise, I’m here to help you achieve all your real estate goals and turn your dreams into reality!
I’m passionate about helping buyers and sellers navigate the exciting real estate landscape in Blue Ridge, Texas! Whether you’re searching for your dream home, exploring land options, or looking for commercial properties, my Real Estate Services have you covered.
Contact me today for all your real estate needs in Blue Ridge, Texas! Call/text 214-940-8149

Discover Yearly Real Estate Market Trends for Blue Ridge, TX
2003-2010
Blue Ridge, TX Real Estate Market in 2003
Blue Ridge, TX Real Estate Market in 2004
Blue Ridge, TX Real Estate Market in 2005
Blue Ridge, TX Real Estate Market in 2006
Blue Ridge, TX Real Estate Market in 2007
Blue Ridge, TX Real Estate Market in 2008
2011-2020
Blue Ridge, TX Real Estate Market in 2011
Blue Ridge, TX Real Estate Market in 2012
Blue Ridge, TX Real Estate Market in 2013
Blue Ridge, TX Real Estate Market in 2014
Blue Ridge, TX Real Estate Market in 2015
Blue Ridge, TX Real Estate Market in 2016
Blue Ridge, TX Real Estate Market in 2017
Blue Ridge, TX Real Estate Market in 2018
This market analysis is intended solely for educational purposes. This market analysis is based on data sourced from NTREIS, Inc. This analysis is exclusively focused on single-family homes and does not account for other property types. The total number of real estate transactions within the specified period and location may vary. Data accuracy cannot be guaranteed due to potential input errors made by NTREIS users. This market analysis does not account for all new construction home sales. If you need detailed information about recorded property sales or other public records, please contact the appropriate city or county office.