
The 2019 real estate market in Blue Ridge, TX showcased an evolving landscape with increased transaction volumes, larger homes, and a robust mid-market segment. A total of 45 homes were sold during the year, highlighting a surge in activity compared to 2018, alongside significant changes in pricing, property characteristics, and economic factors. The year reflected a balanced market that catered to diverse buyer preferences, offering affordability and high-value opportunities.
Key Takeaways and Trends from Blue Ridge’s 2019 Real Estate Market
Pricing Range:
- Rising minimum and median prices highlighted stronger demand for mid-market and entry-level properties.
- A decline in the maximum price signified reduced activity or buyer pushback in the luxury segment.
Market Efficiency:
- Faster minimum DOM reflected high buyer interest in desirable listings, while longer maximum DOM pointed to market variability.
- Improved close price ratios indicated alignment of buyer and seller expectations.
Unique Outliers:
- The increase in larger homes and expansive lot sizes catered to buyers seeking premium and family-friendly properties.
- A drop in price per square foot made the market more accessible despite rising average and median prices.
Total Homes Closed
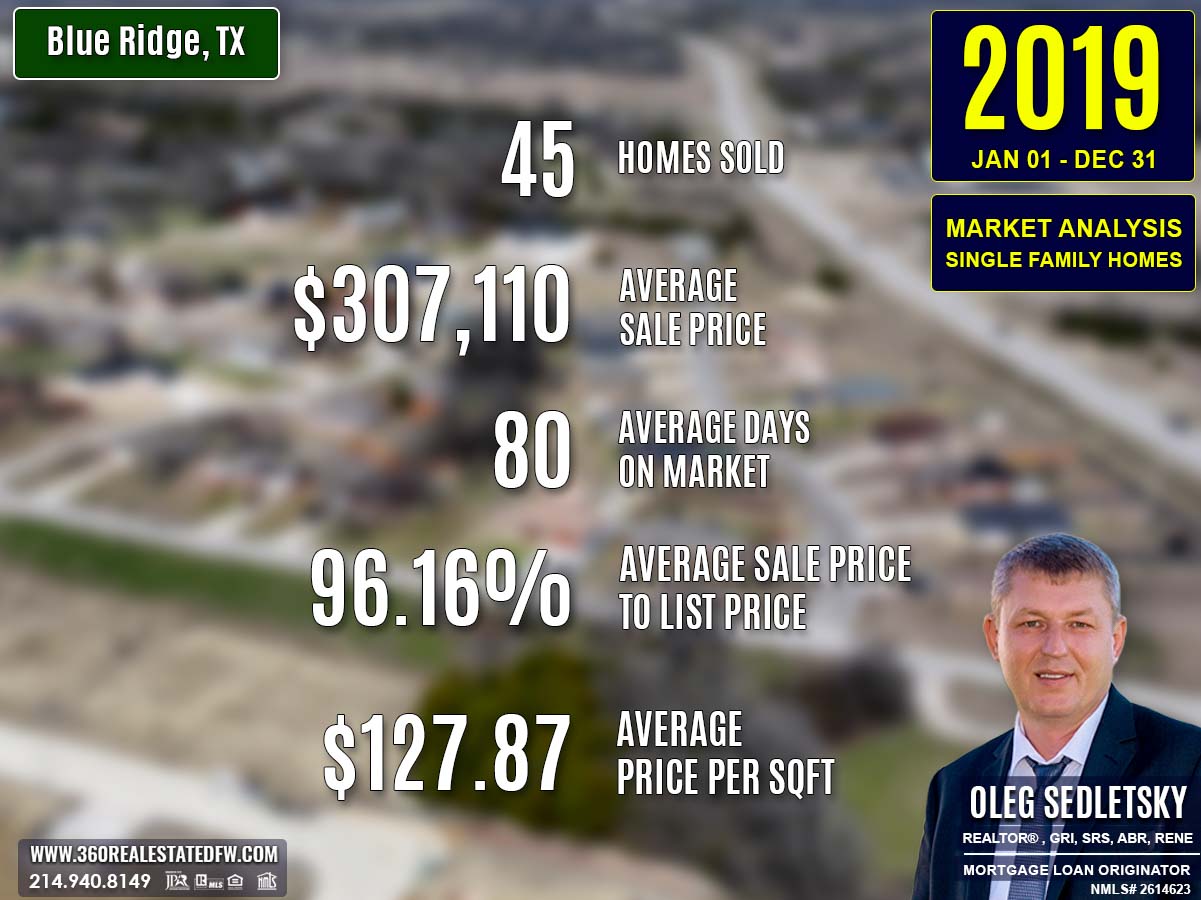
The year concluded with 45 residential single-family homes sold, an increase from the 41 homes closed in 2018. This uptick in sales volume signifies growing buyer interest and confidence in Blue Ridge’s residential market.
Property Pricing Insights
Prices in 2019 painted a picture of diversity and opportunity:
- Minimum Price: Rose to $70,000, up from $55,000 in 2018, showcasing higher valuations in the affordable housing sector.
- Maximum Price: Dropped to $508,474, slightly below the $520,000 high of 2018, indicating less activity in the luxury segment.
- Average Price: Increased to $307,110, up from $283,632, reflecting robust mid-market demand.
- Median Price: Jumped to $340,000, from $302,000 in 2018, further highlighting stronger mid-range market trends.
Property Size and Features
Bedrooms & Bathrooms
- Bedrooms: Homes ranged from 1 to 6 bedrooms, with an average of 4 bedrooms per property, up from 3 in 2018.
- Bathrooms: The number of bathrooms saw growth, with properties featuring up to 7 baths, averaging 3 bathrooms.
Square Footage
- Minimum Size: Held steady at 900 sq. ft., indicating inclusivity in the lower size range.
- Maximum Size: Increased significantly to 5,620 sq. ft., up from 4,012 sq. ft., signaling larger homes entering the market.
- Average Size: Rose to 2,465 sq. ft., from 2,184 sq. ft., showing a clear trend toward spacious properties.
- Median Size: Grew to 2,316 sq. ft., up from 1,827 sq. ft. in the previous year.
Lot Size
- Minimum Lot Size: Remained at 0.130 acres.
- Maximum Lot Size: Expanded to 33.260 acres, from 26.6 acres in 2018, reflecting availability of more extensive properties.
- Average Lot Size: Decreased to 2.992 acres, from 4.375 acres, favoring moderately sized plots.
Market Dynamics
Days on Market (DOM)
- Minimum DOM: Fell to just 2 days, from 13 in 2018, indicating faster sales for highly desirable listings.
- Maximum DOM: Increased to 399 days, up from 215, revealing extended timelines for some properties.
- Average DOM: Lengthened to 80 days, from 62 days, suggesting slower overall market turnover.
Close Price Ratios
- ClsPr/LstPr (Close Price to Listing Price): Improved slightly to 96.16%, up from 95.92%, reflecting better alignment of sale prices with listings.
- ClsPr/OLP (Close Price to Original Listing Price): Increased to 94.23%, up from 93.60%, underscoring price stability through negotiations.
- Price Per Square Foot (Pr$/SqFt): Dropped to $127.87, down from $134.47, reflecting broader affordability across the market.
Insights into the Most Expensive Blue Ridge, TX Property Sold in 2019
The most expensive property sold in 2019 was a spacious and luxurious home offering opulence and comfort.
Key Highlights:
- Price: $508,474
- Bedrooms: 4
- Bathrooms: 4 (3 full and 1 half)
- Square Footage: 4,630 sq. ft.
- Price Per SqFt: $109.82
- Lot Size: 6.640 acres
- Days on Market: 399 days
- ClsPr/LstPr Ratio: 81.36%
- ClsPr/OLP Ratio: 73.69%
- Year Built: 2008
While this property commanded a premium price, the extended DOM and price adjustments underscore negotiation opportunities in the luxury market.
Economic context
Average Electricity Costs in Dallas-Fort Worth in 2019
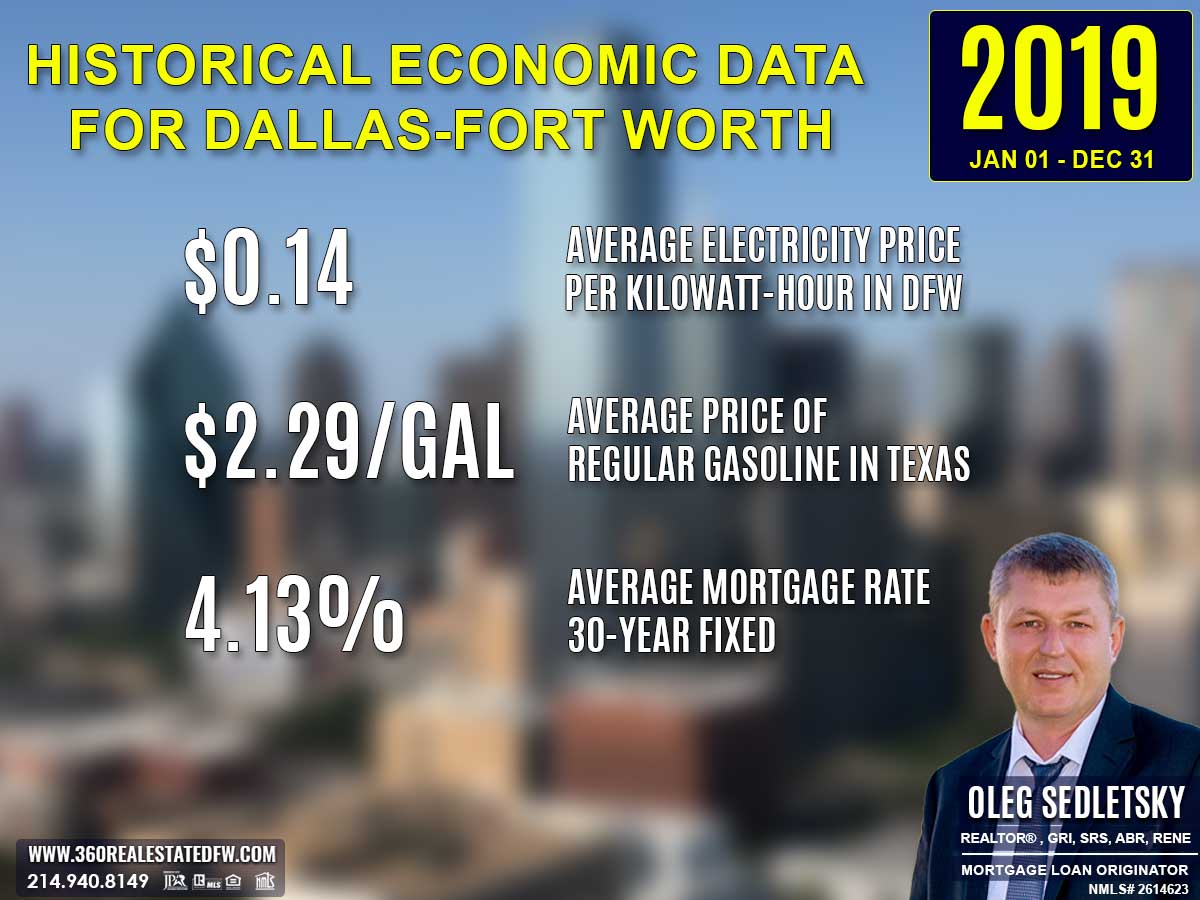
The average electricity cost in 2019 increased to $0.14 per kilowatt-hour, up from $0.13 in 2018. This minor rise reflected the growing cost of utilities that homeowners had to manage.
Texas Average Gas Prices in 2019
Gas prices, however, dropped slightly to $2.29 per gallon, from $2.44 in 2018, offering some relief in transportation costs for residents.
Average 30-Year Fixed Mortgage Rate in 2019
The average 30-year fixed mortgage rate in 2019 dropped to 4.13%, a noticeable improvement from 4.70% the previous year. This decline significantly boosted home affordability, allowing homebuyers to qualify for larger loans and secure better financial terms. Lower mortgage rates helped offset rising home prices in the mid-market, making it an ideal time for homebuyers to step into the property market or upgrade their homes.
Curious about today’s mortgage rates and the home you can comfortably afford?
Submit a no-obligation mortgage application today and get pre-approved to determine your budget and take the first step toward homeownership with confidence.
Summary of Differences Between 2018 and 2019 Real Estate Data for Blue Ridge, TX
The 2019 real estate market in Blue Ridge, TX marked significant shifts compared to 2018, indicating growth in activity and property diversity while reflecting mixed changes in pricing, size, and market dynamics.
Property Pricing
- Minimum Price: Increased to $70,000 in 2019 from $55,000 in 2018, reflecting higher valuations for entry-level homes.
- Maximum Price: Decreased slightly to $508,474, down from $520,000, suggesting a mild softening in the luxury market.
- Average Price: Rose noticeably to $307,110 from $283,632, indicating strengthened buyer activity in mid-market properties.
- Median Price: Increased to $340,000, up from $302,000, reinforcing the rise in mid-range market appeal.
Property Features
- Bedrooms: The average home size grew to 4 bedrooms in 2019, up from 3 bedrooms in 2018, offering larger family accommodations.
- Bathrooms: Properties contained more bathrooms, with a maximum of 7 baths compared to 5 in the previous year.
- Square Footage:
- Minimum Size: Increased to 900 sq. ft., from 720 sq. ft., reflecting fewer compact properties sold.
- Maximum Size: Jumped significantly to 5,620 sq. ft., up from 4,012 sq. ft., supporting a resurgence of larger homes.
- Average Size: Gained to 2,465 sq. ft., from 2,184 sq. ft., indicating a trend toward bigger homes.
- Median Size: Increased to 2,316 sq. ft., compared to 1,827 sq. ft. the previous year.
Lot Size
- Minimum Lot Size: Held steady at 0.130 acres.
- Maximum Lot Size: Grew to 33.260 acres, up from 26.6 acres, signifying more expansive properties available in 2019.
- Average Lot Size: Decreased to 2.992 acres, from 4.375 acres, suggesting a focus on moderately sized lots.
Market Dynamics
- Days on Market (DOM):
- Minimum DOM: Dropped drastically to 2 days from 13, indicating faster turnaround for certain properties.
- Maximum DOM: Increased significantly to 399 days, up from 215, reflecting broader variability in sale timelines.
- Average DOM: Lengthened to 80 days from 62 days, pointing to slower overall transaction speeds.
- ClsPr/LstPr Ratio: Improved slightly to 96.16%, from 95.92%, suggesting better alignment of final sale prices with listing prices.
- ClsPr/OLP Ratio: Increased marginally to 94.23%, compared to 93.6%, reinforcing price stability during sale negotiations.
- Price Per Square Foot (Pr$/SqFt): Declined to $127.87, down from $134.47, reflecting increased affordability despite rising average and median prices.
Year Built
- Oldest Property Built: Shifted further back to properties built in 1910, compared to 1930 in 2018, indicating the presence of older housing stock.
- Newest Property Built: Remained at 2019, demonstrating continued availability of newly constructed homes.
- Average Year Built: Moved forward to 1999 from 1996, showing an overall younger inventory.
- Median Year Built: Increased to 2012, from 2003 in 2018, signifying a notable push for more recently built homes.
Key Market Insights
- Larger Homes: A significant increase in maximum and average square footage suggested a preference for more spacious living.
- Mid-Market Strength: Higher median and average prices highlighted growing trends in mid-range buyer activity.
- Broader Market Dynamics: Faster sales for select listings alongside longer sales for others indicated highly variable buyer-seller engagement.
- Affordability Adjustments: Decline in price per square foot reflected affordability for buyers, even with rising average and median prices.
The 2019 market underscored Blue Ridge’s evolving real estate landscape with enhanced property diversity and demand while balancing affordability and value.
Summary of Real Estate Market Analysis for Blue Ridge, TX in 2019
The 2019 real estate market in Blue Ridge, TX demonstrated resilience, growth, and opportunity as the city navigated a changing landscape. With an uptick in sales volume and larger, more diverse property options, the market catered to a spectrum of buyers, from entry-level purchasers to those seeking spacious, high-value homes. Pricing trends reflected a strengthening mid-market, with rising median prices balanced by improved affordability through lower mortgage rates.
While transaction speeds varied, the consistent improvement in close price ratios signified a more stable harmony between buyer and seller expectations. The year solidified Blue Ridge’s reputation as a vibrant and dynamic housing market, setting the stage for continued prosperity and evolution in the years ahead.
Why Statistics Data is Important
Understanding past market data is essential for making informed decisions in today’s real estate landscape. Historical statistics provide a foundational perspective on trends, aiding in fair pricing and negotiation.
Unlock Exceptional Service!
Assistance with all your real estate needs in the Dallas-Fort Worth area is just a click or call away. Reach out at 214-940-8149 or connect through the links below.

Oleg Sedletsky REALTOR® in Blue Ridge, Texas. Call/Text 214.940.8149
Greetings! I’m Oleg Sedletsky, and I’m excited to introduce myself as your go-to full-time licensed Texas REALTOR® and Mortgage Loan Originator.
I proudly represent JPAR® – Real Estate Brokerage as a REALTOR® and Utopia Mortgage LLC as a Mortgage Loan Originator! My designations and certifications reflect my dedication to helping you achieve your real estate goals in Blue Ridge, TX and other locations in the vibrant Dallas-Fort Worth area!
My commitment to ongoing professional development means I’m always enhancing my skills to serve you better. You can count on me as your trusted expert throughout your real estate journey. Plus, I’m fluent in English, Ukrainian, and Russian and ready to assist you every step of the way!
It’s All About You and Your Real Estate Dreams!
My mission is to serve you! With my knowledge and expertise, I’m here to help you achieve all your real estate goals and turn your dreams into reality!
I’m passionate about helping buyers and sellers navigate the exciting real estate landscape in Blue Ridge, Texas! Whether you’re searching for your dream home, exploring land options, or looking for commercial properties, my Real Estate Services have you covered.
Contact me today for all your real estate needs in Blue Ridge, Texas! Call/text 214-940-8149

Discover Yearly Real Estate Market Trends for Blue Ridge, TX
2003-2010
Blue Ridge, TX Real Estate Market in 2003
Blue Ridge, TX Real Estate Market in 2004
Blue Ridge, TX Real Estate Market in 2005
Blue Ridge, TX Real Estate Market in 2006
Blue Ridge, TX Real Estate Market in 2007
Blue Ridge, TX Real Estate Market in 2008
2011-2020
Blue Ridge, TX Real Estate Market in 2011
Blue Ridge, TX Real Estate Market in 2012
Blue Ridge, TX Real Estate Market in 2013
Blue Ridge, TX Real Estate Market in 2014
Blue Ridge, TX Real Estate Market in 2015
Blue Ridge, TX Real Estate Market in 2016
Blue Ridge, TX Real Estate Market in 2017
Blue Ridge, TX Real Estate Market in 2018
This market analysis is intended solely for educational purposes. This market analysis is based on data sourced from NTREIS, Inc. This analysis is exclusively focused on single-family homes and does not account for other property types. The total number of real estate transactions within the specified period and location may vary. Data accuracy cannot be guaranteed due to potential input errors made by NTREIS users. This market analysis does not account for all new construction home sales. If you need detailed information about recorded property sales or other public records, please contact the appropriate city or county office.