
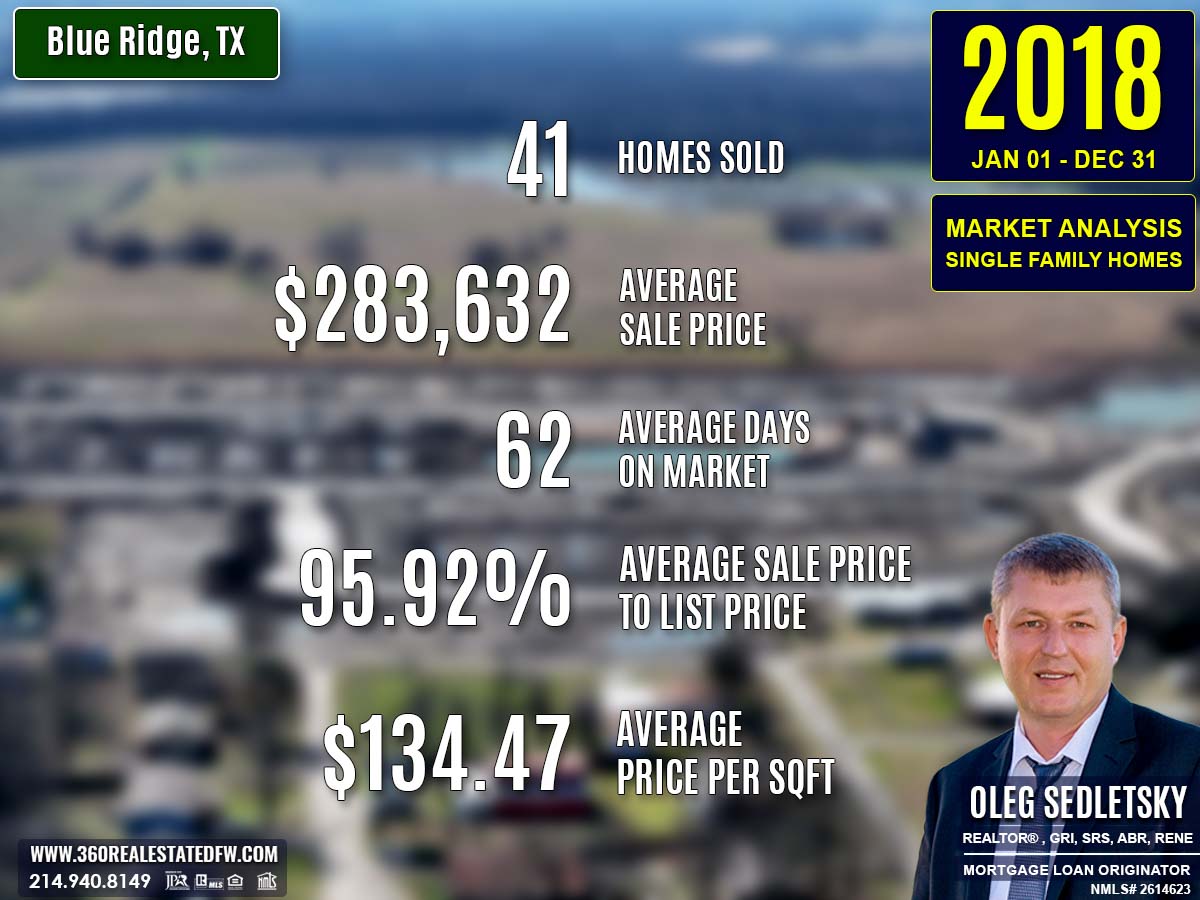
The 2018 real estate market in Blue Ridge, TX showcased a period of evolution and adjustments as the city adapted to shifting housing demands and economic conditions. A total of 41 homes were sold, reflecting slight market softening compared to the prior year, with reduced activity in the mid- and luxury-price segments.
However, the year maintained a competitive environment with diverse property options in terms of size, amenities, and pricing. Key economic factors such as rising mortgage rates and utility costs impacted affordability but did not hinder growth in certain metrics like price per square foot.
Key Takeaways and Trends from Blue Ridge’s 2018 Real Estate Market
Pricing Range: The drop in both maximum and median prices highlighted some softening in the luxury and mid-market segments. However, the market retained opportunities for entry-level buyers with the lower minimum price of $55,000.
Market Efficiency: The slightly longer average DOM and lower close price ratios indicated reduced sales velocity and buyer confidence, partially due to economic shifts.
Unique Outliers: The increase in price per square foot and limited availability of larger homes emphasized changing buyer preferences towards compact, high-value homes.
Total Homes Closed
The year ended with 41 residential single-family homes closed, fewer than the 46 homes sold in 2017. This decline pointed to reduced transaction volume, possibly influenced by changing buyer activity and rising interest rates.
Property Pricing Insights
The 2018 market delivered varied pricing options across different segments:
- Minimum Price: Dropped to $55,000, from $65,000 in 2017, broadening affordability for entry-level buyers.
- Maximum Price: Reduced slightly to $520,000, compared to the $570,000 high seen the prior year.
- Average Price: Declined moderately to $283,632, down from $293,666, indicating tempered overall valuations.
- Median Price: Fell to $302,000, lower than 2017’s $318,250, reflecting reduced mid-market activity.
Property Size and Features
Bedrooms & Bathrooms
- Bedrooms: Ranged from 2 to 5 bedrooms, with an average of 3 bedrooms, slightly lower than the 4-bedroom average in 2017.
- Bathrooms: Homes offered up to 5 baths, with an average of 3 bathrooms, consistent with the previous year.
Square Footage
- Minimum Size: Decreased to 720 sq. ft., down from 900 sq. ft., introducing smaller home options.
- Maximum Size: Reduced to 4,012 sq. ft., compared to 4,538 sq. ft. in 2017.
- Average Size: Moderated to 2,184 sq. ft., down from 2,355 sq. ft., reflecting more compact properties overall.
- Median Size: Dropped to 1,827 sq. ft., from 2,213 sq. ft., suggesting a prevailing trend toward smaller homes.
Lot Size
- Minimum Lot Size: Decreased to 0.130 acres, compared to 0.172 acres in 2017.
- Maximum Lot Size: Reduced to 26.600 acres, down from 49.310 acres, signaling less availability of expansive properties.
- Average Lot Size: Increased slightly to 4.375 acres, from 4.020 acres, reflecting a preference for moderately larger plots.
Market Dynamics
Days on Market (DOM)
- Minimum DOM: Increased significantly to 13 days, up from just 2 days in 2017, indicating slower turnaround for the quickest sales.
- Maximum DOM: Dropped to 215 days, an improvement over the 369-day maximum in the prior year.
- Average DOM: Increased slightly to 62 days, compared to 59 days in 2017, suggesting a slight slowdown in overall sales activity.
Close Price Ratios
- ClsPr/LstPr (Close Price to Listing Price): Declined to 95.92%, from 97.98%, giving buyers more bargaining flexibility.
- ClsPr/OLP (Close Price to Original Listing Price): Dropped to 93.60%, from 96.89%, reflecting increased price adjustments.
- Price Per Square Foot (Pr$/SqFt): Increased to $134.47, up from $131.47 in 2017, indicating strong valuation for smaller, more efficient homes.
Insights into the Most Expensive Blue Ridge, TX Property Sold in 2018
The most expensive property sold in 2018 was a well-appointed, modern home offering substantial value and design appeal.
Key Highlights:
- Price: $520,000
- Bedrooms: 3
- Bathrooms: 2
- Square Footage: 2,273 sq. ft.
- Price Per SqFt: $228.77
- Lot Size: 10.000 acres
- Days on Market: 13 days (fast turn-around time)
- ClsPr/LstPr Ratio: 96.67%
- ClsPr/OLP Ratio: 96.67%
- Year Built: 1999
This property combined modern features with ample space, making it highly desirable in the market.
Economic context
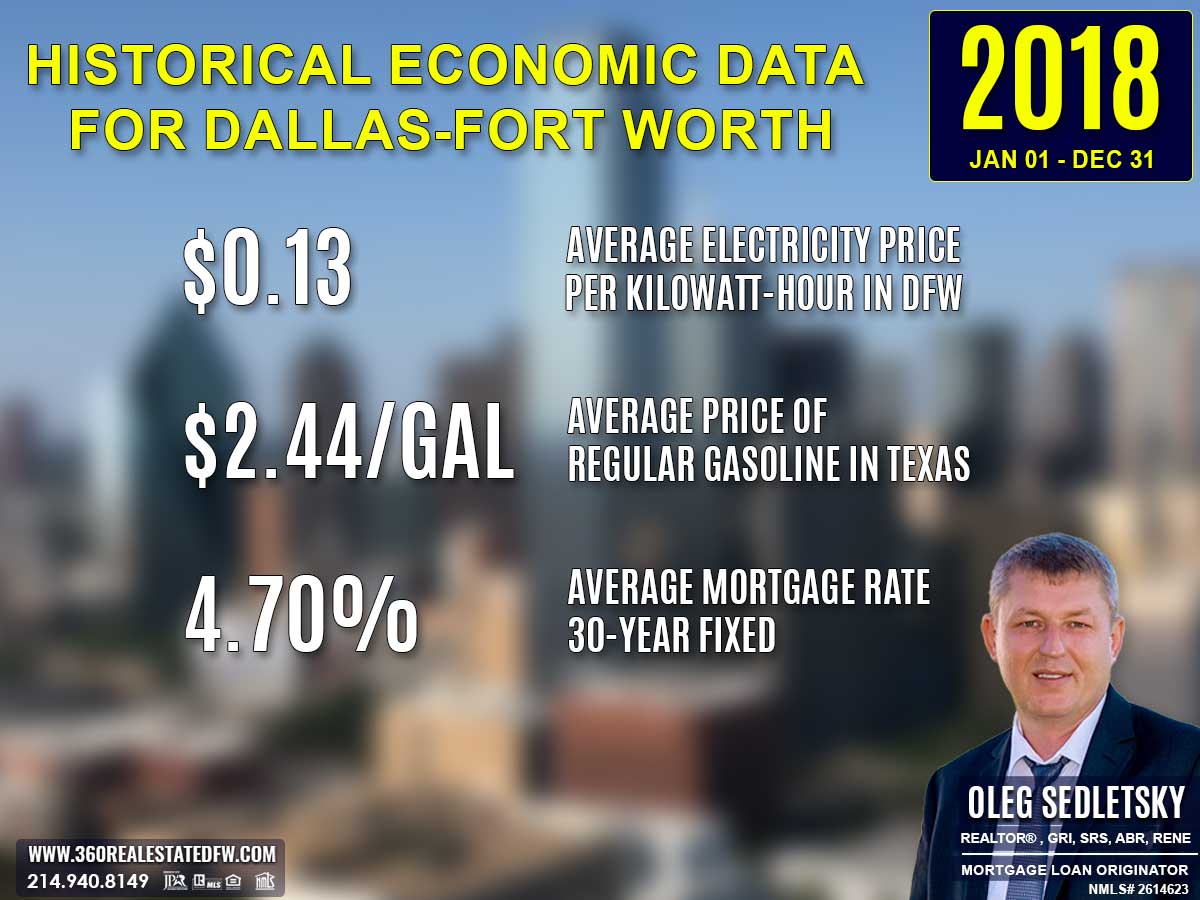
Average Electricity Costs in Dallas-Fort Worth in 2018
The average electricity cost in 2018 increased to $0.13 per kilowatt-hour. Though marginally higher than 2017’s rate, it remained manageable for homeowners and reflected minor increases in utility expenses.
Texas Average Gas Prices in 2018
Gas prices rose to $2.44 per gallon, up from $2.19 in 2017. This increment may have slightly impacted transportation and commuting budgets but was not a significant deterrent for homebuyers.
Average 30-Year Fixed Mortgage Rate in 2018
The average 30-year fixed mortgage rate in 2018 climbed to 4.70%, marking an increase from the 4.14% rate witnessed in 2017. This rise in rates slightly tightened home affordability, potentially influencing buyer activity and market trends. Despite the increase, the rate remained within historical norms, keeping homeownership accessible for many.
Curious about today’s mortgage rates and the home you can comfortably afford?
Submit a no-obligation mortgage application today and get pre-approved to determine your budget and take the first step toward homeownership with confidence.
Summary of Differences Between 2017 and 2018 Real Estate Data for Blue Ridge, TX
The 2018 real estate market in Blue Ridge, TX experienced some notable shifts compared to 2017, reflecting adjustments in property values, buyer activity, and market performance.
Property Pricing
- Minimum Price: Decreased to $55,000 from $65,000, offering greater affordability for entry-level buyers.
- Maximum Price: Dropped slightly to $520,000, compared to $570,000 in 2017, reflecting a softening at the luxury end of the market.
- Average Price: Declined to $283,632 from $293,666, indicating tempered overall property valuations.
- Median Price: Fell to $302,000 from $318,250, signifying reduced activity in the mid-market segment.
Property Size
- Square Footage:
- Minimum Size: Decreased to 720 sq. ft. from 900 sq. ft., signaling smaller homes entering the market.
- Maximum Size: Reduced to 4,012 sq. ft. from 4,538 sq. ft., limiting larger home offerings.
- Average Size: Moderated to 2,184 sq. ft. from 2,355 sq. ft.
- Median Size: Dropped to 1,827 sq. ft. from 2,213 sq. ft., reflecting a smaller average property size overall.
Lot Size
- Minimum Lot Size: Decreased slightly to 0.130 acres from 0.172 acres.
- Maximum Lot Size: Reduced significantly to 26.600 acres from 49.310 acres, suggesting fewer large-lot properties in the mix.
- Average Lot Size: Increased slightly to 4.375 acres from 4.020 acres, showing a mild shift towards moderately larger plots.
Bedrooms and Bathrooms
- Bedrooms: The average number decreased to 3 bedrooms in 2018, down from 4 bedrooms in 2017.
- Bathrooms: Held strong at an average of 3 bathrooms, although the maximum count dropped to 5, from 6 in 2017.
Market Dynamics
-
Days on Market (DOM):
- Minimum DOM: Increased to 13 days from 2 days, indicating a slowdown in the quickest close category.
- Maximum DOM: Reduced to 215 days from 369, suggesting fewer prolonged sales.
- Average DOM: Rose to 62 days from 59 days, indicating slightly longer wait times to close.
-
ClsPr/LstPr Ratio: Decreased marginally to 95.92% from 97.98%, giving buyers slightly more room for negotiation.
-
ClsPr/OLP Ratio: Declined to 93.60% from 96.89%, reflecting more significant price reductions before sales.
-
Price Per Square Foot (Pr$/SqFt): Increased to $134.47 from $131.47, highlighting improved valuations despite lower overall property prices.
Year Built
- Oldest Property Built: Advanced to 1930, from 1919, signaling a removal of older historical homes from the market.
- Newest Property Built: Remained unchanged at 2018, reflecting continued newly built options.
- Average Year Built: Stepped back slightly to 1996 from 2001.
- Median Year Built: Stayed consistent at 2003.
Key Market Shifts
- Softening Prices: Reduced minimum, maximum, average, and median prices suggested slight buyer hesitancy or an adjustment in expectations.
- Smaller Properties Listed: Decreases in property size and lot size metrics reflected changing inventory.
- Moderate Market Activity: Slightly longer average DOM and lower price realization ratios indicated a less competitive environment.
- Improved Value Per Square Foot: The increase in Pr$/SqFt highlighted stronger valuation for smaller or more efficiently designed homes.
Overall, the 2018 market balanced affordability with demand, featuring more compact and value-conscious options while adjusting to evolving buyer preferences and economic conditions.
Summary of Real Estate Market Analysis for Blue Ridge, TX in 2018
The 2018 real estate market in Blue Ridge, TX highlighted a year of adaptation and stabilization. With a slight decrease in sales volume and moderation in pricing trends, the market catered to a balance of affordability and value. HomeBuyers benefited from lower entry-point prices and a wide range of property options, while sellers saw improved valuations with a rise in price per square foot.
Despite a minor slowdown in transaction speeds and tighter financing conditions, the market maintained resilience, offering opportunities for both seasoned investors and first-time homebuyers. The year closed on a stable note, setting the stage for potential growth and further evolution in the years ahead.
Why Statistics Data is Important
Understanding past market data is essential for making informed decisions in today’s real estate landscape. Historical statistics provide a foundational perspective on trends, aiding in fair pricing and negotiation.
Unlock Exceptional Service!
Assistance with all your real estate needs in the Dallas-Fort Worth area is just a click or call away. Reach out at 214-940-8149 or connect through the links below.

Oleg Sedletsky REALTOR® in Blue Ridge, Texas. Call/Text 214.940.8149
Greetings! I’m Oleg Sedletsky, and I’m excited to introduce myself as your go-to full-time licensed Texas REALTOR® and Mortgage Loan Originator.
I proudly represent JPAR® – Real Estate Brokerage as a REALTOR® and Utopia Mortgage LLC as a Mortgage Loan Originator! My designations and certifications reflect my dedication to helping you achieve your real estate goals in Blue Ridge, TX and other locations in the vibrant Dallas-Fort Worth area!
My commitment to ongoing professional development means I’m always enhancing my skills to serve you better. You can count on me as your trusted expert throughout your real estate journey. Plus, I’m fluent in English, Ukrainian, and Russian and ready to assist you every step of the way!
It’s All About You and Your Real Estate Dreams!
My mission is to serve you! With my knowledge and expertise, I’m here to help you achieve all your real estate goals and turn your dreams into reality!
I’m passionate about helping buyers and sellers navigate the exciting real estate landscape in Blue Ridge, Texas! Whether you’re searching for your dream home, exploring land options, or looking for commercial properties, my Real Estate Services have you covered.
Contact me today for all your real estate needs in Blue Ridge, Texas! Call/text 214-940-8149

Discover Yearly Real Estate Market Trends for Blue Ridge, TX
2003-2010
Blue Ridge, TX Real Estate Market in 2003
Blue Ridge, TX Real Estate Market in 2004
Blue Ridge, TX Real Estate Market in 2005
Blue Ridge, TX Real Estate Market in 2006
Blue Ridge, TX Real Estate Market in 2007
Blue Ridge, TX Real Estate Market in 2008
2011-2020
Blue Ridge, TX Real Estate Market in 2011
Blue Ridge, TX Real Estate Market in 2012
Blue Ridge, TX Real Estate Market in 2013
Blue Ridge, TX Real Estate Market in 2014
Blue Ridge, TX Real Estate Market in 2015
Blue Ridge, TX Real Estate Market in 2016
Blue Ridge, TX Real Estate Market in 2017
Blue Ridge, TX Real Estate Market in 2018
This market analysis is intended solely for educational purposes. This market analysis is based on data sourced from NTREIS, Inc. This analysis is exclusively focused on single-family homes and does not account for other property types. The total number of real estate transactions within the specified period and location may vary. Data accuracy cannot be guaranteed due to potential input errors made by NTREIS users. This market analysis does not account for all new construction home sales. If you need detailed information about recorded property sales or other public records, please contact the appropriate city or county office.