
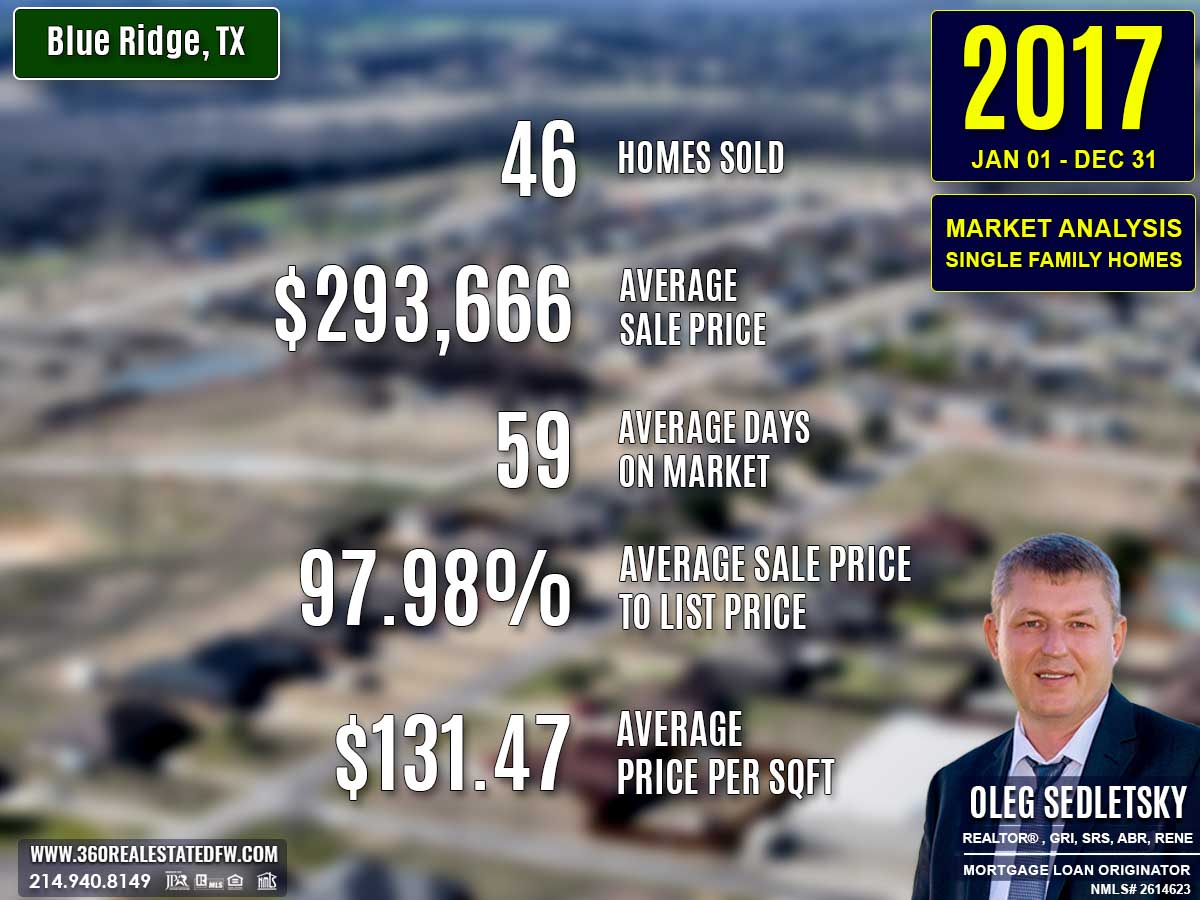
The year 2017 marked a period of strong activity and growth for Blue Ridge, Texas’s real estate market. With 46 homes sold, a significant rise from 35 sales in 2016, the market demonstrated heightened buyer demand and expanding opportunities.
Housing prices continued to climb, properties showcased greater diversity, and market dynamics improved, making it a fruitful year for both Home-buyers and Home-sellers. Additionally, economic factors such as low mortgage rates and moderate cost increases maintained affordability and encouraged homeownership.
Key Takeaways and Trends from Blue Ridge’s 2017 Real Estate Market
Pricing Range: The market emphasized growth in all pricing tiers, with both the average and median prices reflecting stronger demand. The broad spectrum of property values, ranging from $65,000 to $570,000, catered to diverse buyers, strengthening the mid- and luxury-market segments.
Market Efficiency: The average time on the market improved dramatically to 59 days, reflecting enhanced efficiency. Higher close price percentages and reduced price adjustments before sale reinforced a seller-friendly environment.
Unique Outliers:
- The largest property spanned 49.310 acres, showcasing opportunities for rural retreats or large estates.
- At $527.78 per square foot, the priciest home demonstrated premium valuation potential in Blue Ridge.
Total Homes Closed
In 2017, 46 single-family residential homes were sold, marking a significant increase of 11 homes compared to the 35 sold in 2016. This growth reflected a thriving market driven by increased buyer engagement and varied property options.
Property Pricing Insights
The 2017 market saw an upward trajectory in home pricing, accompanied by a broad range of affordability:
- Minimum Price: $65,000 (matched with 2016), keeping entry points affordable.
- Maximum Price: $570,000, slightly higher than 2016’s $568,500, indicating continued strength in luxury homes.
- Average Price: $293,666, rising from $281,767, showcasing an overall increase in market value.
- Median Price: $318,250, up from $300,000, underscoring robust mid-market demand.
Property Size and Features
The homes sold in 2017 offered a mix of configurations to meet diverse buyer preferences:
Bedrooms & Bathrooms
- Bedrooms: Homes featured 2 to 5 bedrooms, with an average of 4 bedrooms, consistent with 2016 levels.
- Bathrooms: Ranges expanded to up to 6 bathrooms, with an average of 3 bathrooms, slightly more than the year before.
Square Footage
- Minimum Size: 900 sq. ft., slightly smaller than 2016’s 1,024 sq. ft.
- Maximum Size: Grew to 4,538 sq. ft., from 4,000 sq. ft.
- Average Size: 2,355 sq. ft., a slight increase from 2,348 sq. ft. in 2016.
- Median Size: Increased moderately to 2,213 sq. ft., from 2,162 sq. ft., reflecting a preference for spacious homes.
Lot Size
- Minimum Lot Size: Increased slightly to 0.172 acres, from 0.151 acres in 2016.
- Maximum Lot Size: Expanded significantly to 49.310 acres, from 36.587 acres, showcasing broader land opportunities.
- Average Lot Size: Decreased to 4.020 acres, from 4.574 acres, reflecting diversity in property offerings.
Market Dynamics
Days on Market (DOM)
The market exhibited improved efficiency in 2017:
- Minimum DOM: Decreased to 2 days, from 4 days in 2016, enabling quicker sales for well-positioned properties.
- Maximum DOM: Dropped slightly to 369 days, from 400 days.
- Average DOM: Improved significantly to 59 days, down from 86 days, signaling faster property turnovers.
Close Price Ratios
- ClsPr/LstPr (Close Price to Listing Price): Increased to 97.98%, from 95.15%, showing greater alignment between list and sale prices.
- ClsPr/OLP (Close Price to Original Listing Price): Improved to 96.89%, from 93.51%, indicating reduced price reductions prior to closing.
- Price Per Square Foot: Jumped to $131.47, up from $118.01 in 2016, reflecting stronger valuation.
Insights into the Most Expensive Blue Ridge, TX Property Sold in 2017
The priciest home sold in 2017 was a historic estate that seamlessly blended timeless charm, unmatched exclusivity, and a sprawling 49.3-acre lot.
Property Highlights:
- Price: $570,000
- Bedrooms: 2
- Bathrooms: 1
- Square Footage: 1,080 sq. ft.
- Price Per SqFt: $527.78
- Lot Size: 49.310 acres
- Days on Market: 77 days
- ClsPr/LstPr Ratio: 95.00%
- ClsPr/OLP Ratio: 95.00%
- Year Built: 1919
This extraordinary property offered vast acreage, a cozy living space, and a unique historical appeal in Blue Ridge’s housing landscape.
Economic context
Average Electricity Costs in Dallas-Fort Worth in 2017
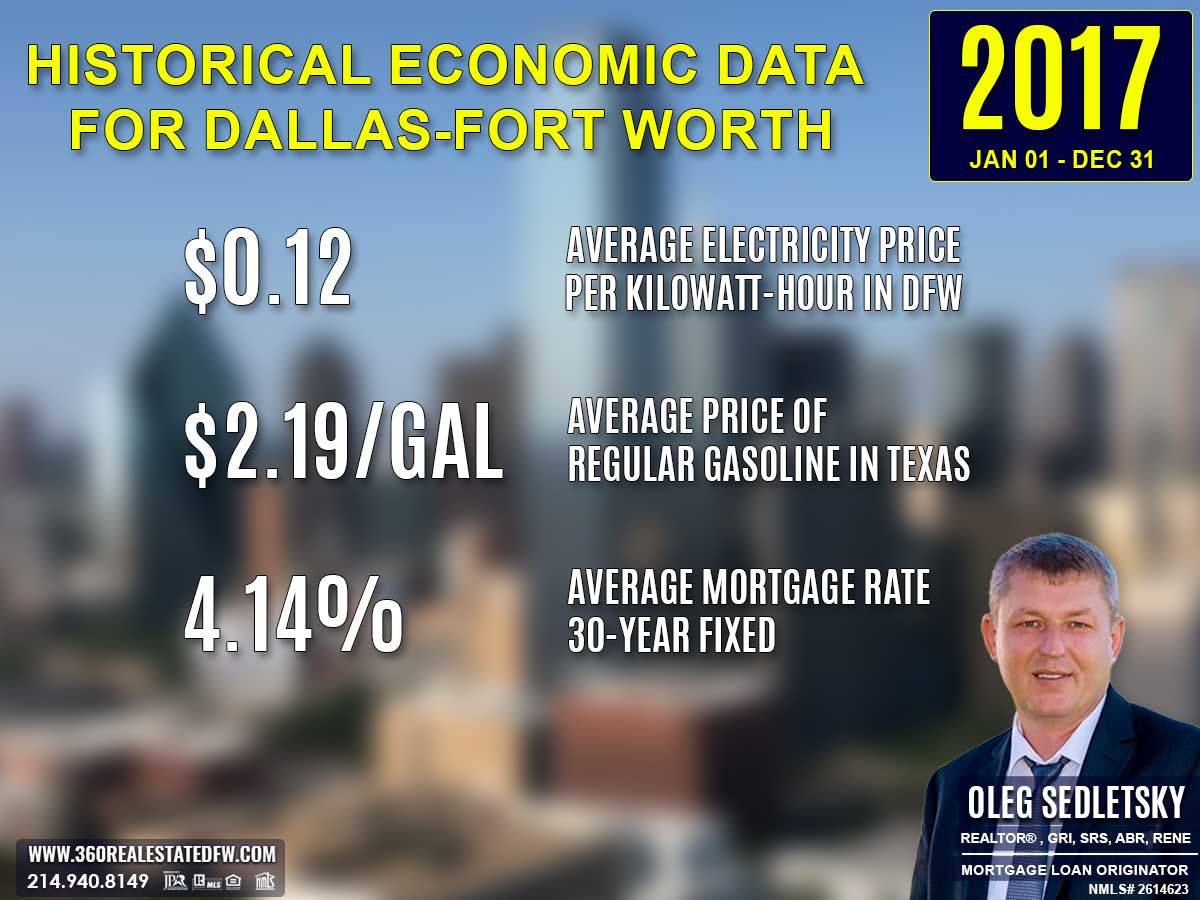
The average electricity cost in 2017 increased slightly to $0.12 per kilowatt-hour. Although higher than the previous year, this rate remained affordable for homeowners, balancing utility bills effectively.
Texas Average Gas Prices in 2017
Gas prices rose to an average of $2.19 per gallon, up from $1.91. This increase may have impacted commuting costs but remained manageable for homebuyers.
Average 30-Year Fixed Mortgage Rate in 2017
The average 30-year fixed mortgage rate in 2017 was 4.14%, reflecting a modest increase from the previous year’s 3.79%. Despite this rise, the rate remained historically low, making home financing accessible for many buyers. This affordability encouraged broader participation in the real estate market, enabling buyers to secure loans for both entry-level and premium properties.
Curious about today’s mortgage rates and the home you can comfortably afford?
Submit a no-obligation mortgage application today and get pre-approved to determine your budget and take the first step toward homeownership with confidence.
Summary of Differences Between 2016 and 2017 Real Estate Data for Blue Ridge, TX
The 2017 real estate market in Blue Ridge, Texas showed notable shifts and trends compared to 2016, including increased sales volume, rising prices, and evolving market dynamics.
Property Pricing
- Minimum Price: Stayed consistent at $65,000, maintaining affordability for entry-level buyers.
- Maximum Price: Increased slightly to $570,000, from $568,500 in 2016, showing strength in the high-end market.
- Average Price: Rose to $293,666, up from $281,767, indicating further growth in property values.
- Median Price: Jumped to $318,250 from $300,000, reflecting robust demand in the mid-market segment.
Property Features
- Bedrooms: Varied from 2 to 5, compared to 2 to 6 in 2016. The average remained steady at 4 bedrooms.
- Bathrooms: Expanded to 1 to 6 baths, up from 1 to 5, with the average staying at 3 bathrooms.
- Square Footage:
- Minimum Size: Decreased slightly to 900 sq. ft., from 1,024 sq. ft.
- Maximum Size: Increased to 4,538 sq. ft., up from 4,000 sq. ft.
- Average Size: Stayed nearly the same at 2,355 sq. ft., compared to 2,348 sq. ft.
- Median Size: Grew moderately to 2,213 sq. ft., from 2,162 sq. ft.
Lot Size
- Minimum Lot Size: Increased slightly to 0.172 acres, up from 0.151 acres.
- Maximum Lot Size: Expanded significantly to 49.310 acres, compared to 36.587 acres, catering to buyers seeking larger spaces.
- Average Lot Size: Decreased to 4.020 acres from 4.574 acres, showing a focus on compact properties.
Market Dynamics
-
Days on Market (DOM):
- Minimum DOM: Dropped to 2 days, down from 4 days, signifying quicker sales for efficiently priced properties.
- Maximum DOM: Fell to 369 days, from 400 days, reducing the duration of extended sales.
- Average DOM: Decreased dramatically to 59 days, from 86 days, reflecting improved market efficiency.
-
ClsPr/LstPr (Close Price to Listing Price): Improved significantly to 97.98%, from 95.15%, showcasing stronger alignment between list and sale prices.
-
ClsPr/OLP (Close Price to Original Listing Price): Rose to 96.89%, from 93.51%, indicating fewer price reductions before a sale.
-
Price Per Square Foot (Pr$/SqFt): Increased sharply to $131.47, from $118.01, highlighting further property value appreciation.
Year Built
- Oldest Property Built: Shifted to 1919, from 1938, indicating the inclusion of older, historical homes in 2017.
- Newest Property Built: Remained at 2017, showing ongoing opportunities in new constructions.
- Average Year Built: Advanced to 2001, from 1997, favoring more modern homes.
- Median Year Built: Progressed to 2015, from 2003, signifying a trend toward newer properties.
Notable Market Shifts
- Higher Prices: The boost in average and median prices, paired with an increased price per square foot, reflects strong demand and market growth.
- Improved Efficiency: The significant reduction in average Days on Market (DOM) and higher close price ratios demonstrate a competitive and efficient market.
- Unique Outliers: The substantial increase in the largest lot size to over 49 acres and a new pricing high of $570,000 indicate greater diversity within the market framework.
Overall, the 2017 market in Blue Ridge proved to be dynamic, with heightened activity, sharper pricing trends, and enhancements in market efficiency, making it a pivotal year.
Summary of Real Estate Market Analysis for Blue Ridge, TX in 2017
The 2017 real estate market in Blue Ridge, TX showcased significant progress, demonstrating an active and thriving housing sector. With a notable rise in total sales and sustained growth in property values, the market provided excellent opportunities for buyers and sellers across various segments.
Pricing trends pointed to a strengthening mid- to upper-market sector, while faster sales cycles and improved market efficiency emphasized a competitive and dynamic environment. Economic conditions, including historically low mortgage rates and manageable utility costs, supported continued buyer interest and accessibility.
Ultimately, 2017 reinforced Blue Ridge‘s position as a robust and evolving real estate market, attracting both new homeowners and seasoned investors while setting a solid foundation for future growth.
Why Statistics Data is Important
Understanding past market data is essential for making informed decisions in today’s real estate landscape. Historical statistics provide a foundational perspective on trends, aiding in fair pricing and negotiation.
Unlock Exceptional Service!
Assistance with all your real estate needs in the Dallas-Fort Worth area is just a click or call away. Reach out at 214-940-8149 or connect through the links below.

Oleg Sedletsky REALTOR® in Blue Ridge, Texas. Call/Text 214.940.8149
Greetings! I’m Oleg Sedletsky, and I’m excited to introduce myself as your go-to full-time licensed Texas REALTOR® and Mortgage Loan Originator.
I proudly represent JPAR® – Real Estate Brokerage as a REALTOR® and Utopia Mortgage LLC as a Mortgage Loan Originator! My designations and certifications reflect my dedication to helping you achieve your real estate goals in Blue Ridge, TX and other locations in the vibrant Dallas-Fort Worth area!
My commitment to ongoing professional development means I’m always enhancing my skills to serve you better. You can count on me as your trusted expert throughout your real estate journey. Plus, I’m fluent in English, Ukrainian, and Russian and ready to assist you every step of the way!
It’s All About You and Your Real Estate Dreams!
My mission is to serve you! With my knowledge and expertise, I’m here to help you achieve all your real estate goals and turn your dreams into reality!
I’m passionate about helping buyers and sellers navigate the exciting real estate landscape in Blue Ridge, Texas! Whether you’re searching for your dream home, exploring land options, or looking for commercial properties, my Real Estate Services have you covered.
Contact me today for all your real estate needs in Blue Ridge, Texas! Call/text 214-940-8149

Discover Yearly Real Estate Market Trends for Blue Ridge, TX
2003-2010
Blue Ridge, TX Real Estate Market in 2003
Blue Ridge, TX Real Estate Market in 2004
Blue Ridge, TX Real Estate Market in 2005
Blue Ridge, TX Real Estate Market in 2006
Blue Ridge, TX Real Estate Market in 2007
Blue Ridge, TX Real Estate Market in 2008
2011-2020
Blue Ridge, TX Real Estate Market in 2011
Blue Ridge, TX Real Estate Market in 2012
Blue Ridge, TX Real Estate Market in 2013
Blue Ridge, TX Real Estate Market in 2014
Blue Ridge, TX Real Estate Market in 2015
Blue Ridge, TX Real Estate Market in 2016
Blue Ridge, TX Real Estate Market in 2017
Blue Ridge, TX Real Estate Market in 2018
This market analysis is intended solely for educational purposes. This market analysis is based on data sourced from NTREIS, Inc. This analysis is exclusively focused on single-family homes and does not account for other property types. The total number of real estate transactions within the specified period and location may vary. Data accuracy cannot be guaranteed due to potential input errors made by NTREIS users. This market analysis does not account for all new construction home sales. If you need detailed information about recorded property sales or other public records, please contact the appropriate city or county office.