
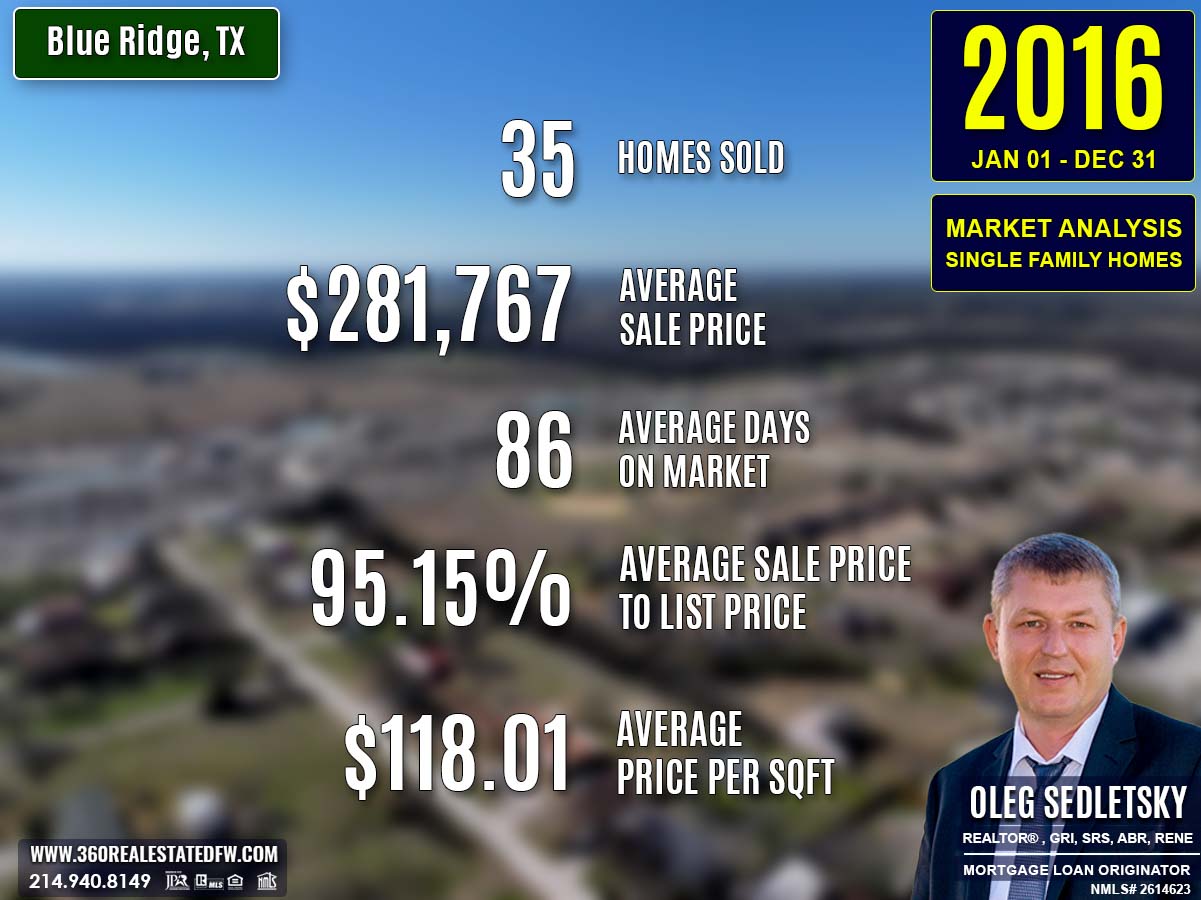
The year 2016 marked a period of expanded opportunities, rising home values, and broad appeal in Blue Ridge, Texas’s real estate market. With 35 homes sold, the market showed steady activity, maintaining momentum from previous years.
Larger homes with modern features dominated the market alongside rising price trends, reflecting a growing demand for family-oriented living spaces. Lower gas prices, electricity costs, and declining mortgage rates enhanced affordability, making 2016 a notable year for both home-buyers and home-sellers.
Key Takeaways and Trends from Blue Ridge’s 2016 Real Estate Market
Pricing Range: The 2016 market exhibited a clear trend of rising prices, with a sharp increase in both average and median sales prices. While the luxury market showed a slight contraction, the mid-market segment surged, catering to growing demand.
Market Efficiency: The average DOM increased slightly to 86 days, reflecting the higher valuation and larger size of properties sold. However, the market maintained a strong ClsPr/LstPr Ratio of 95.15%, showcasing stable negotiation dynamics.
Unique Outliers:
- The largest property sold spanned 36.587 acres, showing strong demand for spacious land options.
- Price per square foot rose to $118.01, an indicator of rising property values across all segments.
Total Homes Closed
A total of 35 residential single-family homes were sold in 2016, maintaining consistency in closed sales compared to the 34 homes sold in 2015. The market continued to cater to varied buyer demands, from smaller homes to expansive estates.
Property Pricing Insights
The 2016 market showed growth in property values across multiple pricing points, offering a range to suit diverse buyers:
- Minimum Price: $65,000, a significant increase from 2015’s $21,000, indicating growth in starter home options.
- Maximum Price: $568,500, showing a slight decrease from the 2015 high of $699,000.
- Average Price: $281,767, a remarkable jump from $200,022 in 2015, pointing to an overall rise in home values.
- Median Price: $300,000, nearly doubling from the previous year’s $142,100, signaling a stronger preference for mid-level homes.
Property Size and Features
Bedrooms & Bathrooms
The year saw an increase in both size and variety for living spaces:
- Bedrooms: Expanded to options ranging from 2 to 6 bedrooms, with an average of 4 bedrooms.
- Bathrooms: Homes offered configurations between 1 and 5 baths, with an average of 3 bathrooms, a boost from 2 in 2015.
Square Footage
Buyers had access to larger homes in 2016 compared to previous years:
- Minimum Size: 1,024 sq. ft.
- Maximum Size: 4,000 sq. ft.
- Average Size: 2,348 sq. ft., a considerable increase from 1,943 sq. ft. in 2015.
- Median Size: 2,162 sq. ft., showing a market shift toward bigger, family-oriented homes.
Lot Size
- Minimum Lot Size: 0.151 acres.
- Maximum Lot Size: 36.587 acres, an increase from 2015’s 19.500 acres, providing options for spacious living.
- Average Lot Size: 4.574 acres.
Market Dynamics
Days on Market (DOM)
Market efficiency adjusted slightly in 2016:
- Minimum DOM: 4 days.
- Maximum DOM: 400 days, slightly shorter than 463 days in 2015.
- Average DOM: 86 days, a slight increase from 65 days, signaling larger and higher-priced inventory requiring longer sale times.
Close Price Ratios
- ClsPr/LstPr (Close Price to Listing Price): Maintained at 95.15%, consistent with 2015, showing stable buyer-seller negotiation alignment.
- ClsPr/OLP (Close Price to Original Listing Price): Decreased slightly to 93.51%, indicating more frequent price adjustments during the selling process.
- Price Per Square Foot (Pr$/SqFt): Rose sharply to $118.01, up from $92.06, reflecting increased property value.
Insights into the Most Expensive Blue Ridge, TX Property Sold in 2016
The most expensive home sold in 2016 encapsulated luxury and space, setting a benchmark in Blue Ridge, TX.
Property Highlights:
- Price: $568,500
- Bedrooms: 4
- Bathrooms: 3 (2 full, 1 half)
- Square Footage: 3,206 sq. ft.
- Price per SqFt: $177.32
- Lot Size: 36.587 acres
- Days on Market: 121 days
- ClsPr/LstPr Ratio: 94.94%
- ClsPr/OLP Ratio: 87.46%
- Year Built: 2008
This stunning property exemplified modern living on a grand scale, offering both expansive indoor space and vast acreage, ideal for high-end buyers seeking privacy and sophistication.
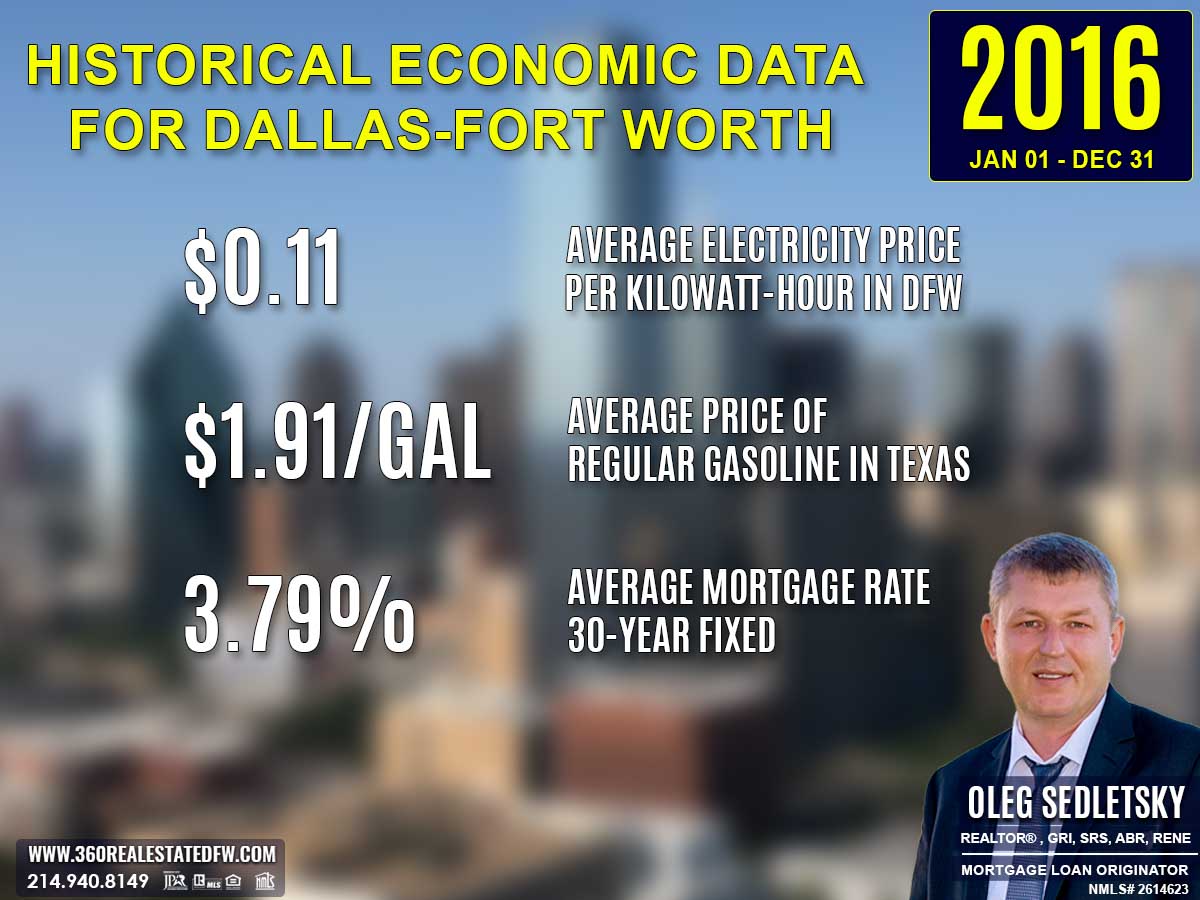
Economic context
Average Electricity Costs in Dallas-Fort Worth in 2016
The average electricity cost in 2016 dropped to $0.11 per kilowatt-hour, providing cost savings to homeowners and adding appeal to energy-efficient properties.
Texas Average Gas Prices in 2016
Fuel costs continued to decline, with gas averaging $1.91 per gallon. This drop made commuting more affordable, likely boosting suburban appeal for homebuyers in Blue Ridge, Texas.
Average 30-Year Fixed Mortgage Rate in 2016
The average 30-year fixed mortgage rate in 2016 was 3.79%, marking a slight decrease from the previous year. This low rate significantly boosted housing affordability, making it easier for homebuyers to secure financing and invest in larger or higher-value properties. With such favorable rates, many homebuyers were able to enter the market or upgrade to larger homes, driving demand and supporting rising home values.
Curious about today’s mortgage rates and the home you can comfortably afford?
Submit a no-obligation mortgage application today and get pre-approved to determine your budget and take the first step toward homeownership with confidence.
Summary of Differences Between 2015 and 2016 Real Estate Data for Blue Ridge, TX
The year 2016 brought notable changes to Blue Ridge’s real estate market compared to 2015. The trends showcased a shift toward larger homes, higher average pricing, and more diversity in property features. Here’s a breakdown of the key differences:
Property Pricing
- Minimum Price: Rose significantly to $65,000 in 2016 (up from $21,000 in 2015), signaling strengthened entry-level market values.
- Maximum Price: Decreased to $568,500 (from $699,000), indicating reduced high-end property sales.
- Average Price: Jumped to $281,767, a remarkable increase from $200,022 in 2015, suggesting overall property value appreciation.
- Median Price: Increased to $300,000 in 2016, almost doubling 2015’s $142,100, reflecting stronger mid-market sales.
Property Features
- Bedrooms: Expanded from 2-4 bedroom options in 2015 to 2-6 bedroom properties in 2016, offering more spacious homes.
- Bathrooms: Grew in range, with 2016 properties including up to 5 baths compared to 4 in 2015.
- Square Footage:
- Minimum Size: Increased to 1,024 sq. ft. (from 780 sq. ft.), emphasizing larger homes overall.
- Maximum Size: Slightly contracted to 4,000 sq. ft. (from 4,500 sq. ft.).
- Average Size: Rose significantly to 2,348 sq. ft. in 2016, from 1,943 sq. ft. in 2015, catering to families and groups needing bigger spaces.
- Median Size: Increased to 2,162 sq. ft., reflecting a preference for larger standard homes.
Lot Size
- Minimum Lot Size: Slightly decreased to 0.151 acres in 2016 (from 0.230 acres in 2015).
- Maximum Lot Size: Expanded to 36.587 acres (from 19.500 acres), creating opportunities for buyers seeking more land.
- Average Lot Size: Grew to 4.574 acres (from 4.445 acres), reflecting increased diversity.
Market Dynamics
-
Days on Market (DOM):
- Minimum DOM: Rose modestly to 4 days (from 2 days), indicating some cooling for quick sales.
- Maximum DOM: Lowered to 400 days in 2016 (compared to 463 days), only slightly trimming extended sale times for unique properties.
- Average DOM: Lengthened to 86 days (from 65 days), potentially reflecting higher-priced property adjustments.
-
ClsPr/LstPr (Close Price to List Price Ratio): Stayed consistent at around 95% across both years, showing stable buyer-seller pricing alignment.
-
ClsPr/OLP (Close Price to Original Listing Price): Lowered slightly to 93.51% (from 93.09%), indicating a marginal increase in price adjustments before closing.
-
Price Per Square Foot (Pr$/SqFt): Increased significantly to $118.01 (from $92.06), signaling rising property valuation.
Year Built
- Oldest Property Built: Adjusted to 1938 in 2016 (from 1910 in 2015), showing a shift in older inventory.
- Newest Property Built: Stayed consistent at 2016, reflecting continued opportunities for new builds.
- Average Year Built: Improved to 1997 (from 1985 in 2015), favoring more modern homes.
- Median Year Built: Moved up to 2003 (from 1991), highlighting newer home options.
Notable Market Shifts
- Bigger Homes: Increase in average number of bedrooms, bathrooms, and square footage showcased a demand for larger homes.
- Rising Prices: A striking surge in both median and average sales prices underlined increased property value.
- Market Timing: Longer average time on market and expanded price per square foot indicated a maturing, premium-focused market.
Overall, 2016 reflected a market evolving toward higher value, larger family-oriented living options, and a steadily growing economy.
Summary of Real Estate Market Analysis for Blue Ridge, TX in 2016
The 2016 real estate market in Blue Ridge, Texas showcased a year of consistent activity, expanding opportunities, and noticeable growth in property values. With a balance of affordability and rising demand for larger, family-oriented homes, the market evolved to meet the needs of homebuyers. Key trends, like the increase in average and median prices, emphasized a strengthening mid-market segment, while favorable economic factors such as lower electricity costs, gas prices, and mortgage rates further encouraged homeownership.
Sellers benefited from stable negotiation dynamics and steady demand, making 2016 a year of mutual opportunity. Blue Ridge’s real estate market remained resilient and forward-moving, setting a positive foundation for years to come.
Why Statistics Data is Important
Understanding past market data is essential for making informed decisions in today’s real estate landscape. Historical statistics provide a foundational perspective on trends, aiding in fair pricing and negotiation.
Unlock Exceptional Service!
Assistance with all your real estate needs in the Dallas-Fort Worth area is just a click or call away. Reach out at 214-940-8149 or connect through the links below.

Oleg Sedletsky REALTOR® in Blue Ridge, Texas. Call/Text 214.940.8149
Greetings! I’m Oleg Sedletsky, and I’m excited to introduce myself as your go-to full-time licensed Texas REALTOR® and Mortgage Loan Originator.
I proudly represent JPAR® – Real Estate Brokerage as a REALTOR® and Utopia Mortgage LLC as a Mortgage Loan Originator! My designations and certifications reflect my dedication to helping you achieve your real estate goals in Blue Ridge, TX and other locations in the vibrant Dallas-Fort Worth area!
My commitment to ongoing professional development means I’m always enhancing my skills to serve you better. You can count on me as your trusted expert throughout your real estate journey. Plus, I’m fluent in English, Ukrainian, and Russian and ready to assist you every step of the way!
It’s All About You and Your Real Estate Dreams!
My mission is to serve you! With my knowledge and expertise, I’m here to help you achieve all your real estate goals and turn your dreams into reality!
I’m passionate about helping buyers and sellers navigate the exciting real estate landscape in Blue Ridge, Texas! Whether you’re searching for your dream home, exploring land options, or looking for commercial properties, my Real Estate Services have you covered.
Contact me today for all your real estate needs in Blue Ridge, Texas! Call/text 214-940-8149

Discover Yearly Real Estate Market Trends for Blue Ridge, TX
2003-2010
Blue Ridge, TX Real Estate Market in 2003
Blue Ridge, TX Real Estate Market in 2004
Blue Ridge, TX Real Estate Market in 2005
Blue Ridge, TX Real Estate Market in 2006
Blue Ridge, TX Real Estate Market in 2007
Blue Ridge, TX Real Estate Market in 2008
2011-2020
Blue Ridge, TX Real Estate Market in 2011
Blue Ridge, TX Real Estate Market in 2012
Blue Ridge, TX Real Estate Market in 2013
Blue Ridge, TX Real Estate Market in 2014
Blue Ridge, TX Real Estate Market in 2015
Blue Ridge, TX Real Estate Market in 2016
Blue Ridge, TX Real Estate Market in 2017
Blue Ridge, TX Real Estate Market in 2018
This market analysis is intended solely for educational purposes. This market analysis is based on data sourced from NTREIS, Inc. This analysis is exclusively focused on single-family homes and does not account for other property types. The total number of real estate transactions within the specified period and location may vary. Data accuracy cannot be guaranteed due to potential input errors made by NTREIS users. This market analysis does not account for all new construction home sales. If you need detailed information about recorded property sales or other public records, please contact the appropriate city or county office.