
The 2013 real estate market in Blue Ridge, TX transitioned into a stabilization phase following the growth witnessed in prior years. With 21 single-family homes sold, the market displayed steady activity while re-calibrating prices and features to align with mid-market demands. Changing home-buyer preferences, affordability trends, and evolving economic conditions influenced the market’s dynamics, paving the way for a sustainable housing landscape.
Key Takeaways and Trends from Blue Ridge’s 2013 Real Estate Market
Pricing Range: The 2013 market experienced a noticeable decline in price ranges, with reduced maximum prices signaling lower luxury sales. Simultaneously, the affordability of entry-level homes remained a priority, as illustrated by declines in minimum and median prices. These trends underscored the market’s focus on value-driven buyers and mid-market affordability.
Market Efficiency: Efficiency remained strong, with shortened DOM and improved ClsPr/LstPr and ClsPr/OLP ratios. Sellers benefitted from faster turnovers, achieving close-to-list prices, while buyers enjoyed fair market rates, sustaining a balanced marketplace.
Unique Outliers: The most prominent outliers included smaller, affordable homes at one end and limited luxury availability at the other. Expansive properties with large lots became noticeably scarcer in 2013, with inventory aligning more closely with functional, family-friendly housing.
Total Homes Closed
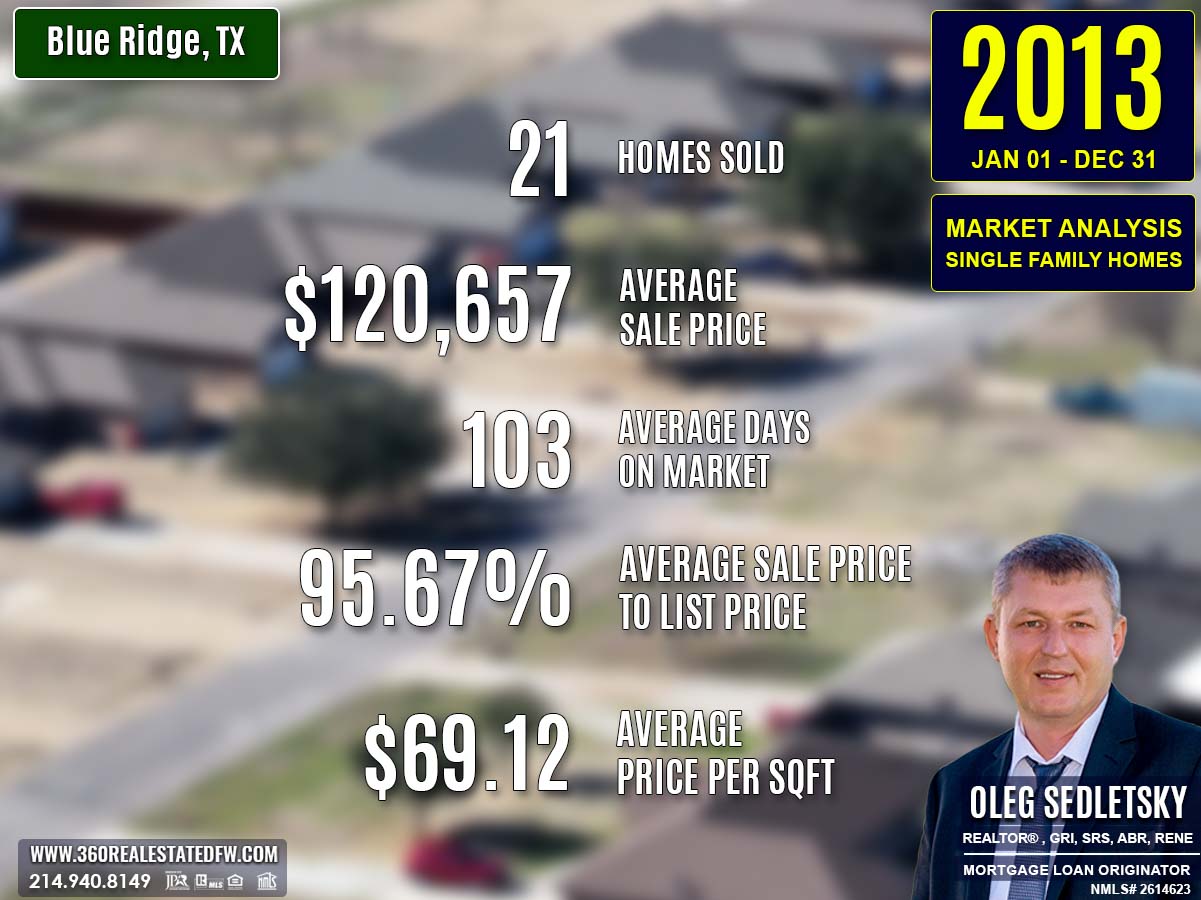
A total of 21 residential single-family homes were sold in 2013. This number marked a slowdown from 27 sales in 2012, reflecting a shift toward steady yet moderate buyer activity.
Property Pricing Insights
Property prices in 2013 adjusted to reflect affordability and the growing preference for mid-market homes:
- Minimum Price: $25,500, a drop from 2012’s $31,501, highlighting better affordability.
- Maximum Price: $260,000, down from $422,000 in 2012, indicating lower luxury market activity.
- Average Price: $120,657, a decline from $170,390 in 2012, showing a general market re-calibration.
- Median Price: $102,000, down from $118,000, underscoring consistent affordability in the mid-market segment.
The downward adjustments in price metrics demonstrated buyer preference for smaller, cost-effective homes over expansive luxury properties.
Property Size and Features
The properties sold in 2013 catered to families and individuals seeking functional, mid-sized homes:
- Bedrooms: Ranged from 3 to 4 bedrooms, averaging 3 bedrooms, accommodating family needs.
- Bathrooms: Offered up to 3 total baths, with most having 2 full baths, aligning with modern living standards.
- Square Footage:
- Minimum Size: 792 sq. ft., smaller than 2012’s smallest at 800 sq. ft., ensuring compact options.
- Maximum Size: 2,429 sq. ft., a significant decline from 4,684 sq. ft. in 2012, indicative of reduced luxury offerings.
- Average Size: 1,684 sq. ft., down from 1,966 sq. ft., reflecting buyer favor toward practical living spaces.
- Median Size: 1,741 sq. ft., relatively consistent with previous years, satisfying mid-market buyers.
Lot Sizes
Lot sizes also experienced a contraction:
- Minimum Lot Size: 0.070 acres, up from 0.000 acres, removing townhome-style listings.
- Maximum Lot Size: 20.000 acres, lower than 47.470 acres in 2012, signaling fewer expansive lots.
- Average Lot Size: 3.559 acres, reduced from 7.686 acres, reflecting manageable ownership preferences.
Market Dynamics
Efficiency remained a hallmark of the Blue Ridge, TX market in 2013, even as transaction volume slowed:
-
Days on Market (DOM):
- Minimum DOM: 7 days, slightly more than 5 in 2012, indicating longer quick sales.
- Maximum DOM: 289 days, shorter than 381, demonstrating better turnover of high-end homes.
- Average DOM: Improved to 103 days, a slight decrease from 111 in 2012.
-
ClsPr/LstPr Ratio (Close Price to List Price): Rose to 95.67%, reflecting sellers achieving prices close to their listings.
-
ClsPr/OLP Ratio (Close Price to Original Listing Price): Improved slightly to 90.65%, showcasing solid market demand and negotiable pricing trends.
-
Price Per Square Foot (Pr$/SqFt): Fell to $69.12 from $83.11 in 2012, reflecting the market’s re-calibrated valuations.
Insights into the Most Expensive Blue Ridge, TX Property Sold in 2013
The highest-priced sale of 2013 epitomized a shift toward functional luxury within the mid-market. Selling for $260,000, this home combined practical interior layouts with manageable outdoor space.
Key Highlights:
- Price: $260,000
- Bedrooms: 4
- Bathrooms: 3 (2 full and 1 half bath)
- Square Footage: 2,255 sq. ft.
- Price Per Square Foot: $115.30
- Lot Size: 3.800 acres
- Days on Market (DOM): 34 days
- ClsPr/LstPr Ratio: 98.11%
- ClsPr/OLP Ratio: 98.11%
- Year Built: 2003
This home appealed to buyers seeking move-in-ready properties with modern amenities on a spacious yet manageable lot.
Economic context
Average Electricity Costs in Dallas-Fort Worth in 2013
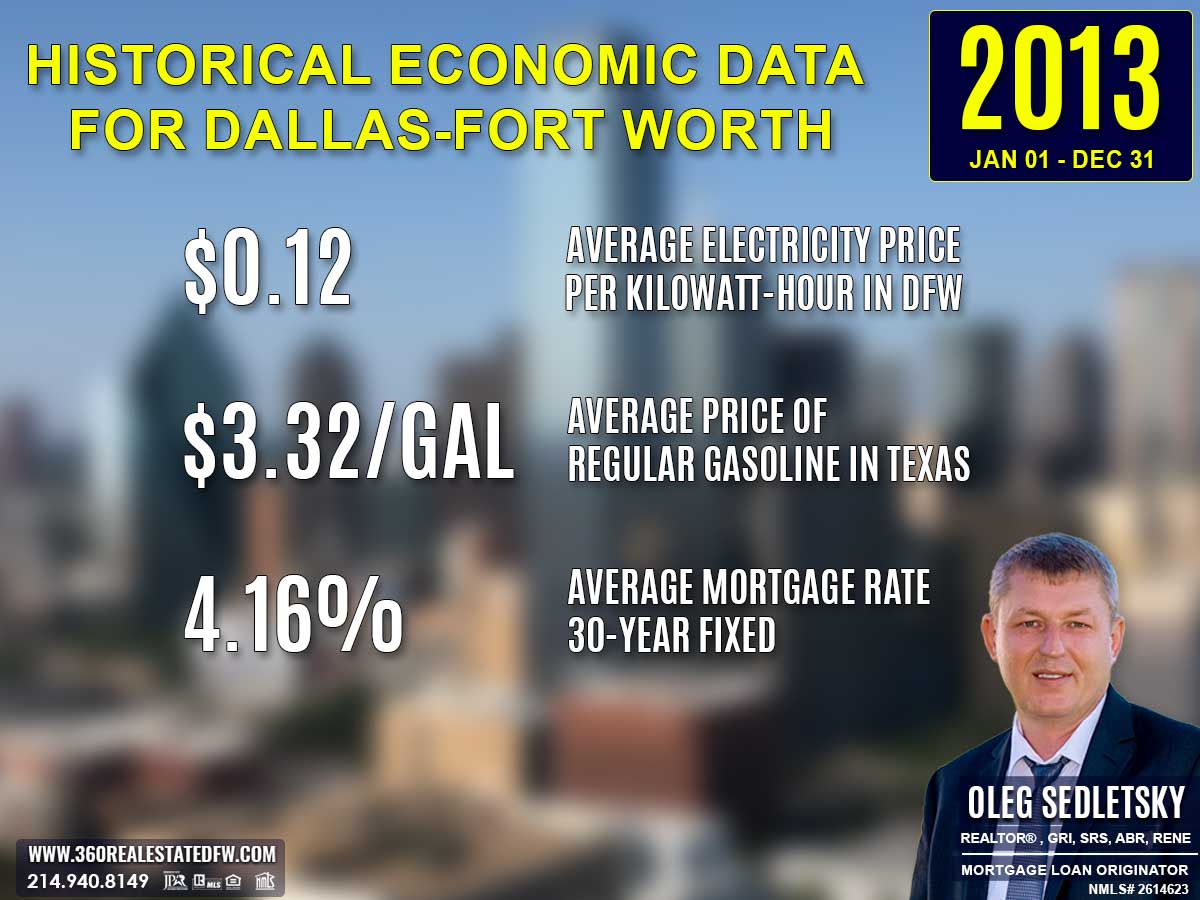
Electricity costs edged slightly higher in 2013, with an average price of $0.12 per kilowatt hour. This modest rise nudged utility expenses upward, emphasizing the growing importance of energy-efficient homes in the market.
Texas Average Gas Prices in 2013
The average gas price fell to $3.32 per gallon, offering some relief for homeowners concerned about commuting costs. Properties closer to urban centers became more attractive, as buyers sought savings on transportation amidst economic stabilization.
Average 30-Year Fixed Mortgage Rate in 2013
Mortgage rates climbed to 4.16%, nudging higher but remaining relatively affordable for homebuyers. This slight increase encouraged budget-conscious purchasing patterns.
Curious about today’s mortgage rates and the home you can comfortably afford?
Submit a no-obligation mortgage application today and get pre-approved to determine your budget and take the first step toward homeownership with confidence.
Summary of Differences Between 2012 and 2013 Real Estate Data for Blue Ridge, TX
While the 2012 real estate market in Blue Ridge, TX showed growth and strong activity, 2013 displayed a stabilization period with a shift in pricing trends and property features. Here are the key changes:
Property Pricing Insights
- Minimum Price: Decreased to $25,500 in 2013 (from $31,501 in 2012), marking an increase in affordability for entry-level buyers.
- Maximum Price: Dropped to $260,000 in 2013 (from $422,000 in 2012), reflecting decreased activity in the luxury market.
- Average Price: Declined significantly to $120,657 (from $170,390 in 2012), signaling a market re-calibration to more moderate prices.
- Median Price: Fell to $102,000 (from $118,000), underscoring a shift toward mid-market affordability.
Property Features
-
Bedrooms:
- Minimum Bedrooms: Increased to 3 in 2013 (from 1 in 2012), focusing on family-sized homes.
- Maximum Bedrooms: Decreased to 4 (from 5 in 2012), limiting availability for larger households.
-
Bathrooms: The maximum decreased to 3 baths in 2013 (from 5 baths in 2012), reflecting fewer luxury home offerings.
-
Square Footage:
- Minimum Size: Shrunk slightly to 792 sq. ft. (from 800 sq. ft.), maintaining compact housing options.
- Maximum Size: Decreased to 2,429 sq. ft. (from 4,684 sq. ft.), lowering inventory of large homes.
- Average Size: Reduced to 1,684 sq. ft. (from 1,966 sq. ft.), showing a preference for mid-sized homes.
- Median Size: Stayed relatively stable at 1,741 sq. ft. (from 1,724 sq. ft.), reinforcing buyer preferences.
Lot Size Area
- Minimum Lot Size: Increased to 0.070 acres in 2013 (from 0.000 acres in 2012), eliminating zero-lot-line options.
- Maximum Lot Size: Lowered significantly to 20.000 acres (from 47.470 acres), tightening availability of large plots.
- Average Lot Size: Decreased to 3.559 acres (from 7.686 acres), reflecting demand for more manageable spaces.
Market Dynamics
-
Days on Market (DOM):
- Minimum DOM: Increased slightly to 7 days (from 5 days in 2012).
- Maximum DOM: Reduced to 289 days (from 381 days), encouraging faster turnover of higher-end properties.
- Average DOM: Shortened to 103 days (from 111 days), highlighting improved overall market efficiency.
-
ClsPr/LstPr Ratio (Close Price to List Price): Edged up to 95.67% (from 95.16%), showing sellers were able to close closer to their asking prices.
-
ClsPr/OLP Ratio (Close Price to Original Listing Price): Improved slightly to 90.65% (from 90.62%), signaling reduced price negotiation.
-
Price Per Square Foot (Pr$/SqFt): Fell to $69.12 (from $83.11), reflecting re-calibrated property valuations.
Year Built
- Oldest Property: Became older, as the oldest property shifted to 1935 (from 1960 in 2012).
- Newest Property: Changed to 2006 (from 2009), indicating less newly-built inventory.
- Average Year Built: Dropped to 1983 (from 1994), showcasing an emphasis on older homes.
- Median Year Built: Lowered to 1988 (from 2000), underscoring the market’s slight shift away from modern construction.
Key Observations
- Re-calibration in Pricing: Decreases in maximum, average, and median prices point to a shift from high-end to mid-market properties, aligning with affordability trends.
- Shift in Property Features: The inventory prioritized mid-sized, family-friendly homes over expansive or luxury properties.
- Improved Market Activity: Shorter average DOM and stable closing-to-list ratios suggest a more efficient marketplace, even as activity slowed slightly.
- Lot Sizes and Age Trend: Smaller lots and older homes gained prominence, indicating a shift in buyer priorities toward manageable properties and affordability.
Overall, the 2013 market in Blue Ridge, TX moved toward stabilization and re-calibration after 2012’s highs, balancing affordability with consistent buyer demand.
Summary of Real Estate Market Analysis for Blue Ridge, TX in 2013
The 2013 Blue Ridge, TX real estate market reflected a transitional phase, focused on re-calibrated prices and family-oriented properties. Home-Buyers continued to show interest in well-valued homes, while Home-Sellers adjusted to market trends favoring practicality over excess. Despite lower transaction volume, strong closing-to-list ratios and reasonable DOM pointed to a healthy and balanced marketplace.
Why Statistics Data is Important
Understanding past market data is essential for making informed decisions in today’s real estate landscape. Historical statistics provide a foundational perspective on trends, aiding in fair pricing and negotiation.
Unlock Exceptional Service!
Assistance with all your real estate needs in the Dallas-Fort Worth area is just a click or call away. Reach out at 214-940-8149 or connect through the links below.

Oleg Sedletsky REALTOR® in Blue Ridge, Texas. Call/Text 214.940.8149
Greetings! I’m Oleg Sedletsky, and I’m excited to introduce myself as your go-to full-time licensed Texas REALTOR® and Mortgage Loan Originator.
I proudly represent JPAR® – Real Estate Brokerage as a REALTOR® and Utopia Mortgage LLC as a Mortgage Loan Originator! My designations and certifications reflect my dedication to helping you achieve your real estate goals in Blue Ridge, TX and other locations in the vibrant Dallas-Fort Worth area!
My commitment to ongoing professional development means I’m always enhancing my skills to serve you better. You can count on me as your trusted expert throughout your real estate journey. Plus, I’m fluent in English, Ukrainian, and Russian and ready to assist you every step of the way!
It’s All About You and Your Real Estate Dreams!
My mission is to serve you! With my knowledge and expertise, I’m here to help you achieve all your real estate goals and turn your dreams into reality!
I’m passionate about helping buyers and sellers navigate the exciting real estate landscape in Blue Ridge, Texas! Whether you’re searching for your dream home, exploring land options, or looking for commercial properties, my Real Estate Services have you covered.
Contact me today for all your real estate needs in Blue Ridge, Texas! Call/text 214-940-8149

Discover Yearly Real Estate Market Trends for Blue Ridge, TX
2003-2010
Blue Ridge, TX Real Estate Market in 2003
Blue Ridge, TX Real Estate Market in 2004
Blue Ridge, TX Real Estate Market in 2005
Blue Ridge, TX Real Estate Market in 2006
Blue Ridge, TX Real Estate Market in 2007
Blue Ridge, TX Real Estate Market in 2008
2011-2020
Blue Ridge, TX Real Estate Market in 2011
Blue Ridge, TX Real Estate Market in 2012
Blue Ridge, TX Real Estate Market in 2013
Blue Ridge, TX Real Estate Market in 2014
Blue Ridge, TX Real Estate Market in 2015
Blue Ridge, TX Real Estate Market in 2016
Blue Ridge, TX Real Estate Market in 2017
Blue Ridge, TX Real Estate Market in 2018
This market analysis is intended solely for educational purposes. This market analysis is based on data sourced from NTREIS, Inc. This analysis is exclusively focused on single-family homes and does not account for other property types. The total number of real estate transactions within the specified period and location may vary. Data accuracy cannot be guaranteed due to potential input errors made by NTREIS users. This market analysis does not account for all new construction home sales. If you need detailed information about recorded property sales or other public records, please contact the appropriate city or county office.