
The 2010 real estate market in Blue Ridge, TX saw shifts, reflecting broader economic challenges and an emphasis on affordability. With 18 homes sold, the market demonstrated a slight increase in activity but also revealed signs of cautious buyer behavior. The dynamics of pricing, property features, and market trends underscored a significant realignment toward value-focused transactions.
Key Takeaways and Trends from Blue Ridge’s 2010 Real Estate Market
Pricing Range: The dramatic reduction in both average and median prices reflects a strong pivot toward affordability. While the maximum price also declined, ultra-affordable listings under $10,000 gained prominence.
Market Efficiency: The sharp rise in average DOM and lower close-to-list price ratios signal a slower market, though a few highly desirable properties saw rapid turnover.
Unique Outliers: The appearance of both highly inexpensive properties and a handful of ultra-large homes (up to 4,179 sq. ft.) showcased market diversity. However, the reduction in average property size and lot area emphasized streamlined options for affordability.
Total Homes Closed
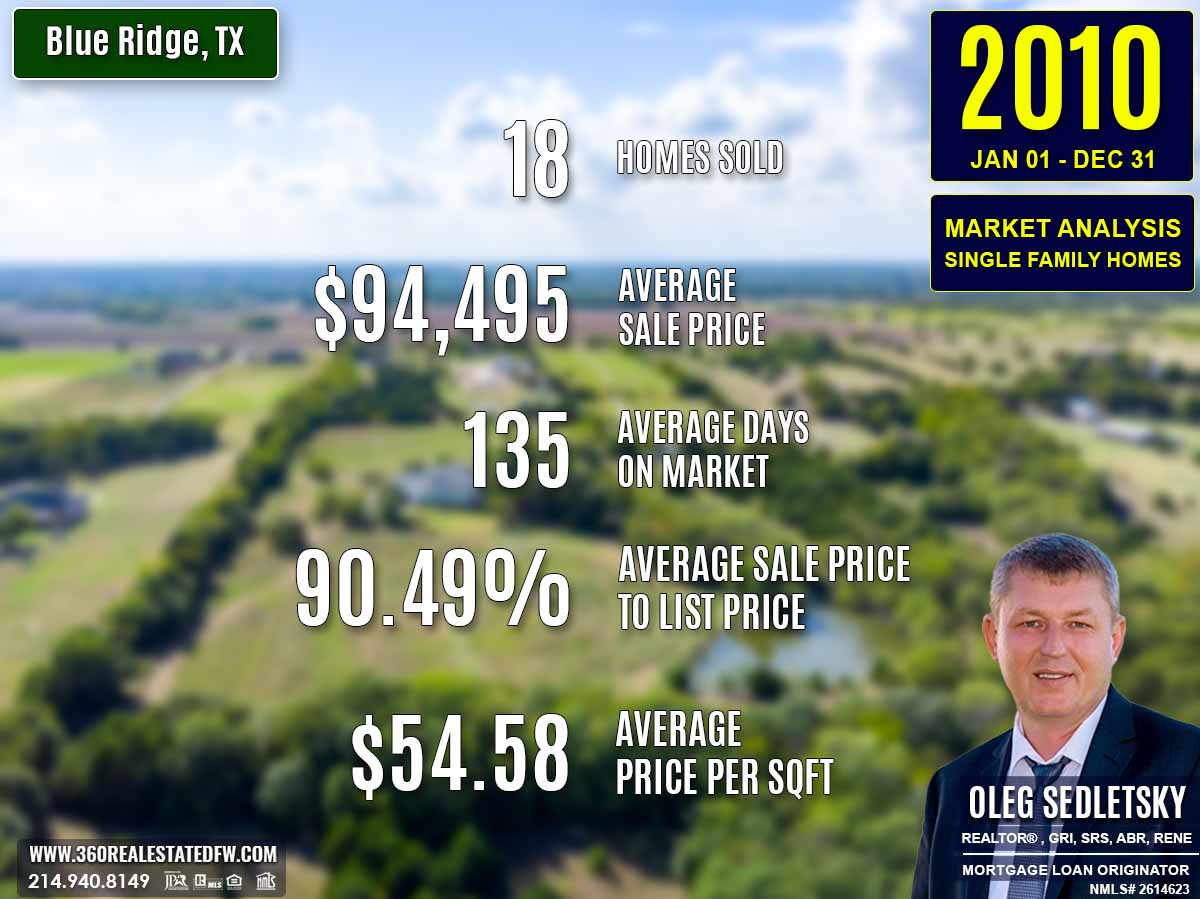
The market recorded 18 closed transactions for residential single-family homes, up just one sale from 2009. This modest growth highlights consistency in market activity despite new economic pressures.
Property Pricing Insights
The 2010 pricing landscape evolved to favor affordability:
- Minimum Price: $5,100 (a dramatic drop from $52,000 in 2009, signaling highly affordable options).
- Maximum Price: $322,000 (down from $380,000, indicating reduced demand in the high-end segment).
- Average Price: $94,495 (a steep decline from $160,508, reflecting softer market conditions).
- Median Price: $72,500 (down from $152,000, emphasizing a significant affordability focus).
The reduction in average and median prices highlights a buyer-driven market with competitive pricing.
Property Size and Features
The range of property sizes and features catered to various buyer demands but leaned toward more modest offerings:
- Bedrooms: Spanned from 1 to 4, averaging 3 bedrooms.
- Bathrooms: Expanded significantly, offering 1 to 5 options, averaging 2 bathrooms.
- Square Footage:
- Minimum Size: 744 sq. ft. (a sharp decline from 1,184 sq. ft. in 2009, inviting ultra-affordable buyers).
- Maximum Size: 4,179 sq. ft. (an increase from the prior year, with ultra-large homes still in demand).
- Average Size: 1,610 sq. ft. (down from 1,973 sq. ft., reflecting a preference for smaller residences).
- Median Size: 1,420 sq. ft. (compared to 2,018 sq. ft. in 2009, a reduction in typical home size).
The data suggests a shift toward more affordable, smaller homes appealing to a broader market.
Market Dynamics
The real estate market in 2010 displayed significant changes in efficiency and seller performance:
- Days on Market (DOM):
- Minimum DOM: 6 days (an improvement from 49 days in 2009, showcasing quick sales for desirable properties).
- Maximum DOM: 495 days (up from 146 days, with some listings stagnating for extended periods).
- Average DOM: 135 days (a notable rise from 53 days, indicating slower overall activity).
- ClsPr/LstPr Ratio: Averaged 90.49%, a decrease from 95.69%, showcasing greater negotiation leverage for buyers.
- ClsPr/OLP Ratio: Averaged 84.59%, a decline from 93.42%, with sellers making deeper price reductions.
- Price Per Square Foot (Pr$/SqFt): Averaged $54.58, a decline from $76.34, reinforcing reduced property values.
The longer sales cycle and greater price concessions indicate a market accommodating cautious buyers.
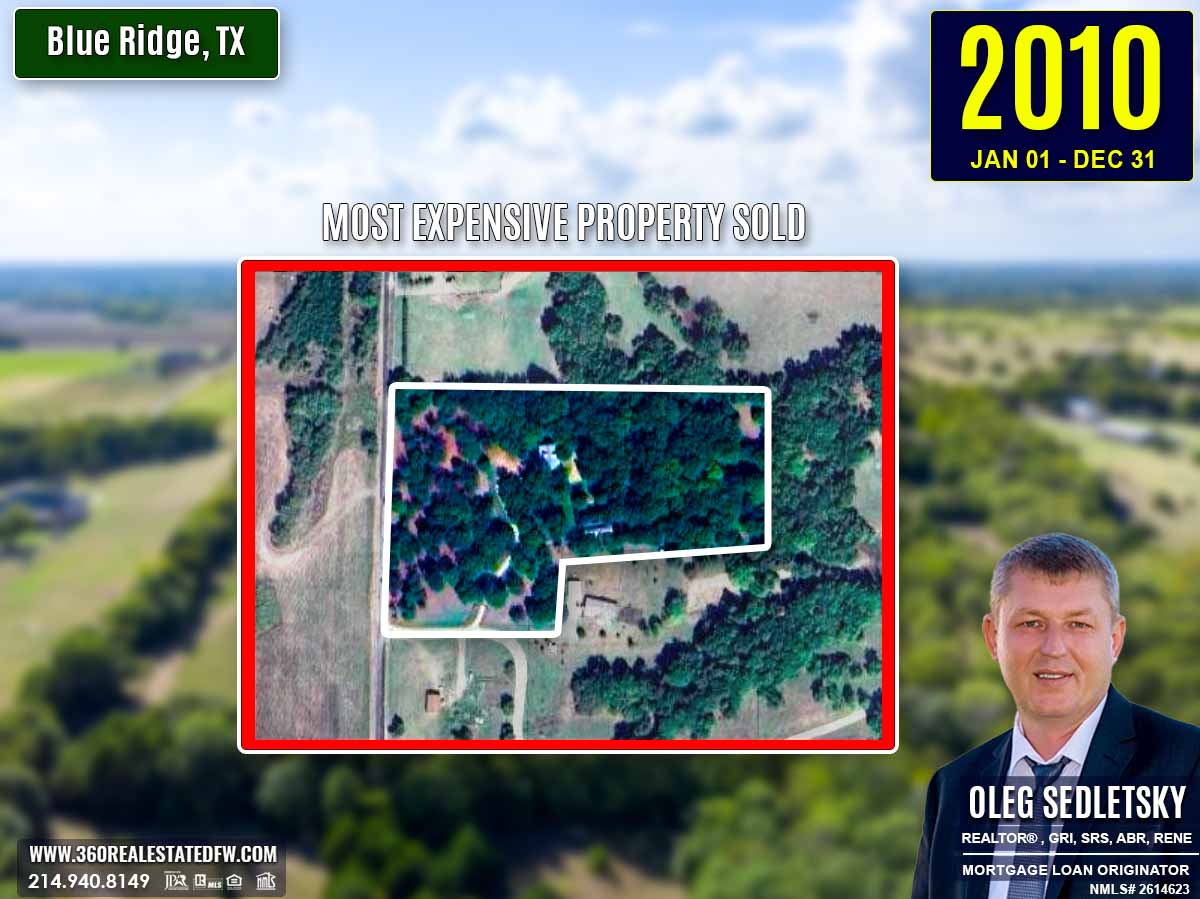
Insights into the Most Expensive Blue Ridge, TX Property Sold in 2010
The most expensive property sold in 2010 demonstrated high-end appeal with modern features. Selling for $322,000, this home offered 2,137 sq. ft. of living space on a 7.776-acre lot:
- Price Per SqFt: $150.68
- Bedrooms: 3
- Bathrooms: 3 (2 full, 1 half)
- ClsPr/LstPr Ratio: 98.17%
- ClsPr/OLP Ratio: 98.17%
- Days on Market (DOM): 90
- Year Built: 1998
This property highlighted resilience in the premium market, appealing to buyers seeking luxury features and ample land.
Economic context
Broader economic changes had mixed effects:
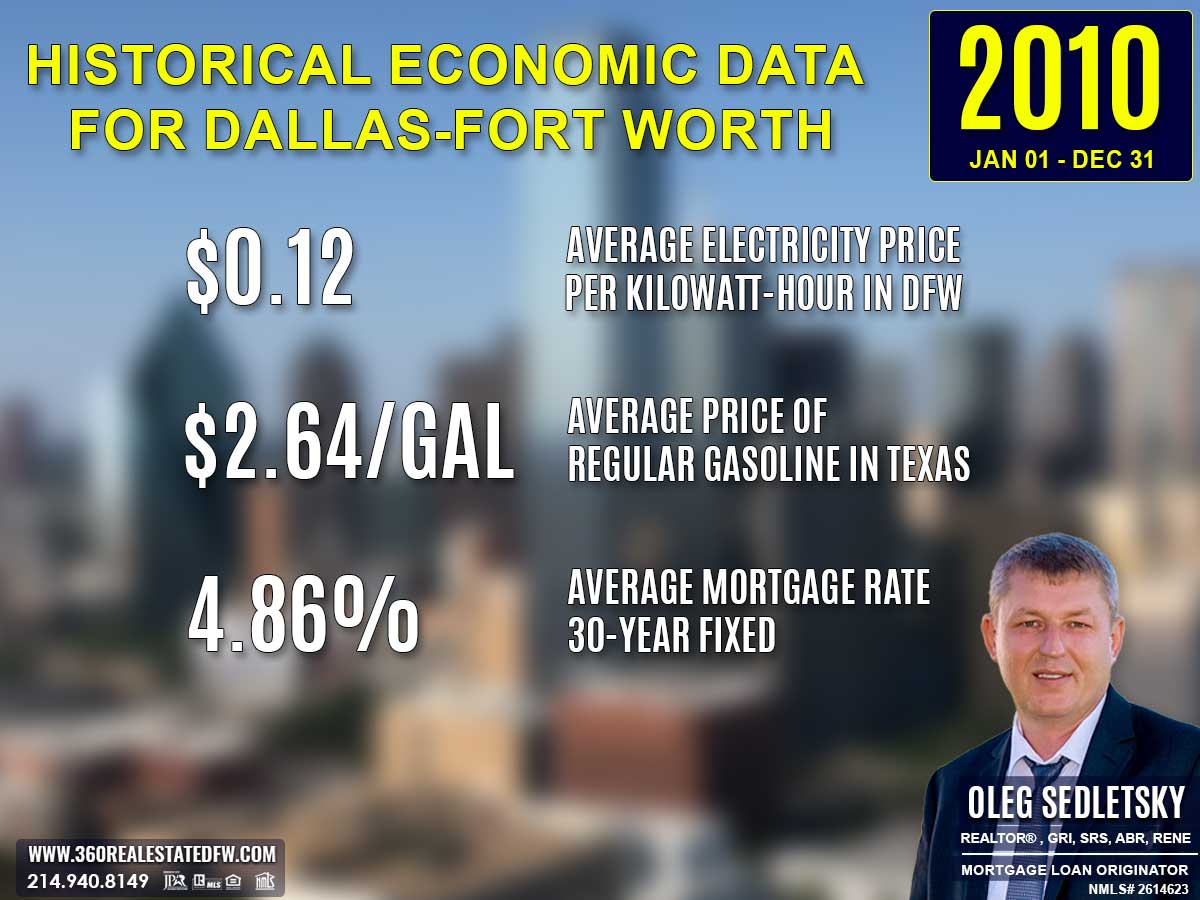
Average Electricity Costs in Dallas-Fort Worth in 2010
The average electricity price in 2010 dropped to $0.12 per kilowatt hour, making homeownership more affordable. This reduction supported households balancing utility costs with other economic pressures.
Texas Average Gas Prices in 2010
Gas prices rose slightly to $2.64 per gallon, but remained far below earlier peaks. While this increased commuting costs, suburban living options still appealed to cost-conscious buyers.
Average 30-Year Fixed Mortgage Rate in 2010
The 30-year fixed mortgage rate fell to 4.86%, offering significant savings on home loans. Buyers were able to secure lower payments, often making larger homes or premium options more accessible.
Curious about today’s mortgage rates and the home you can comfortably afford?
Submit a no-obligation mortgage application today and get pre-approved to determine your budget and take the first step toward homeownership with confidence.
Summary of Differences Between 2009 and 2010 Real Estate Data for Blue Ridge, TX
A comparison of the 2010 and 2009 real estate markets for Blue Ridge, TX reveals significant shifts and adjustments across various metrics:
Property Pricing Insights
- Minimum Current Price: Dropped steeply from $52,000 in 2009 to just $5,100 in 2010, showcasing an increase in ultra-affordable listings.
- Maximum Current Price: Decreased from $380,000 in 2009 to $322,000 in 2010, indicating cooling in the luxury market.
- Average Price: Declined significantly from $160,508 to $94,495, pointing to a buyer-friendly market.
- Median Price: Fell from $152,000 to $72,500, highlighting a shift toward affordability at the market’s midpoint.
Property Features
- Bedrooms: Minimum dropped from 2 in 2009 to 1 in 2010, creating more budget-friendly entry points.
- Bathrooms: Expanded potential, with a range of 1 to 5 bathrooms in 2010 compared to 2 to 4 in 2009, meeting diverse buyer needs.
- Square Footage:
- Minimum Size: Fell from 1,184 sq. ft. in 2009 to 744 sq. ft. in 2010, reflecting smaller, less costly homes entering the market.
- Maximum Size: Increased from 3,400 sq. ft. to 4,179 sq. ft., introducing larger homes for select buyers.
- Average Size: Decreased from 1,973 sq. ft. to 1,610 sq. ft., reflecting a focus on modest home sizes.
- Median Size: Declined from 2,018 sq. ft. to 1,420 sq. ft., signaling an overall reduction in standard home size.
Lot Size Area
- Minimum Lot Size: Increased from 0.051 acres in 2009 to 0.180 acres in 2010, reflecting slight growth in minimum outdoor space.
- Maximum Lot Size: Dropped sharply from 41.000 acres to 7.776 acres, significantly reducing large-lot options.
- Average Lot Size: Fell from 6.567 acres to 1.961 acres, reflecting a scaling down of typical lots offered.
Market Dynamics
- Days on Market (DOM):
- Minimum DOM: Improved from 49 days in 2009 to only 6 days in 2010, showing faster turnover for the quickest sales.
- Maximum DOM: Increased significantly from 146 days to 495 days, indicating longer stagnation for slower-moving listings.
- Average DOM: Rose sharply from 53 days to 135 days, reflecting cautious buyer activity and extended negotiation periods.
- ClsPr/LstPr (Close Price to List Price Ratio): Decreased from 95.69% to 90.49%, indicating greater concessions by sellers.
- ClsPr/OLP (Close Price to Original Listing Price Ratio): Declined from 93.42% to 84.59%, showcasing more substantial price cuts to close deals.
- Price Per Square Foot (Pr$/SqFt): Fell from $76.34 to $54.58, reinforcing lower property valuations per unit area.
Year Built
- Newest Property: Shifted from 2009 in 2009 to 2005 in 2010, indicating fewer brand-new constructions entering the market.
- Oldest Property: Dropped back to 1953 in 2010 from 1975 in 2009, introducing older housing inventory.
- Average Year Built: Declined from 1997 to 1988, emphasizing sales of older properties.
- Median Year Built: Held steady, with a slight decrease from 2000 in 2009 to 1987 in 2010, highlighting the prominence of mid-aged homes.
Key Trends
- Affordability Focus: The steep drop in average and median prices, along with lower price per square foot, signaled a pivot toward an accessible housing market.
- Market Softening: The dramatic rise in average DOM and diminished close-to-list price ratios indicate a slowing market with cautious demand.
- Smaller Homes with Smaller Lots: Reduced square footage and acreage suggest streamlined housing options, focusing on essential needs and affordability.
- Older Inventory: The inclusion of older homes reflects a shifting inventory composition catering to more value-focused buyers.
The 2010 market emphasized affordability and reshaped dynamics, balancing ultra-competitive low-end options with a pullback in luxury offerings and a slower overall pace amidst recovering buyer confidence.
Summary of Real Estate Market Analysis for Blue Ridge, TX in 2010
The 2010 real estate market in Blue Ridge, TX emphasized affordability, negotiation, and adaptation. Home-Buyers benefited from significantly reduced prices and historically low mortgage rates, fostering opportunities for first-time homeowners and investors. Home-Sellers, however, faced challenges with slower sales cycles and greater price reductions being key to closing deals.
The market showcased polarization, with ultra-affordable properties gaining traction while luxury options experienced tempered demand. Meanwhile, smaller homes and older inventory dominated the landscape, catering to value-conscious buyers seeking practicality. Overall, the year marked a re-calibration in Blue Ridge’s market dynamics, offering opportunities for those willing to align with shifting economic realities.
Why Statistics Data is Important
Understanding past market data is essential for making informed decisions in today’s real estate landscape. Historical statistics provide a foundational perspective on trends, aiding in fair pricing and negotiation.
Unlock Exceptional Service!
Assistance with all your real estate needs in the Dallas-Fort Worth area is just a click or call away. Reach out at 214-940-8149 or connect through the links below.

Oleg Sedletsky REALTOR® in Blue Ridge, Texas. Call/Text 214.940.8149
Greetings! I’m Oleg Sedletsky, and I’m excited to introduce myself as your go-to full-time licensed Texas REALTOR® and Mortgage Loan Originator.
I proudly represent JPAR® – Real Estate Brokerage as a REALTOR® and Utopia Mortgage LLC as a Mortgage Loan Originator! My designations and certifications reflect my dedication to helping you achieve your real estate goals in Blue Ridge, TX and other locations in the vibrant Dallas-Fort Worth area!
My commitment to ongoing professional development means I’m always enhancing my skills to serve you better. You can count on me as your trusted expert throughout your real estate journey. Plus, I’m fluent in English, Ukrainian, and Russian and ready to assist you every step of the way!
It’s All About You and Your Real Estate Dreams!
My mission is to serve you! With my knowledge and expertise, I’m here to help you achieve all your real estate goals and turn your dreams into reality!
I’m passionate about helping buyers and sellers navigate the exciting real estate landscape in Blue Ridge, Texas! Whether you’re searching for your dream home, exploring land options, or looking for commercial properties, my Real Estate Services have you covered.
Contact me today for all your real estate needs in Blue Ridge, Texas! Call/text 214-940-8149

Discover Yearly Real Estate Market Trends for Blue Ridge, TX
2003-2010
Blue Ridge, TX Real Estate Market in 2003
Blue Ridge, TX Real Estate Market in 2004
Blue Ridge, TX Real Estate Market in 2005
Blue Ridge, TX Real Estate Market in 2006
Blue Ridge, TX Real Estate Market in 2007
Blue Ridge, TX Real Estate Market in 2008
2011-2020
Blue Ridge, TX Real Estate Market in 2011
Blue Ridge, TX Real Estate Market in 2012
Blue Ridge, TX Real Estate Market in 2013
Blue Ridge, TX Real Estate Market in 2014
Blue Ridge, TX Real Estate Market in 2015
Blue Ridge, TX Real Estate Market in 2016
Blue Ridge, TX Real Estate Market in 2017
Blue Ridge, TX Real Estate Market in 2018
This market analysis is intended solely for educational purposes. This market analysis is based on data sourced from NTREIS, Inc. This analysis is exclusively focused on single-family homes and does not account for other property types. The total number of real estate transactions within the specified period and location may vary. Data accuracy cannot be guaranteed due to potential input errors made by NTREIS users. This market analysis does not account for all new construction home sales. If you need detailed information about recorded property sales or other public records, please contact the appropriate city or county office.