
The 2018 real estate market in Celina, Texas reflected a bustling and competitive landscape, with notable growth in new construction sales and steady demand for properties with premium features like pools. This analysis explores metrics that highlight market pricing, efficiency, and the impact of fluctuating mortgage rates.
Key Takeaways and Trends from the 2018 Real Estate Market in Celina, TX
Pricing Range
Property prices ranged from $90,000 to $2,000,000, and a broader selection of mid- to high-end homes entered the market.
Market Efficiency
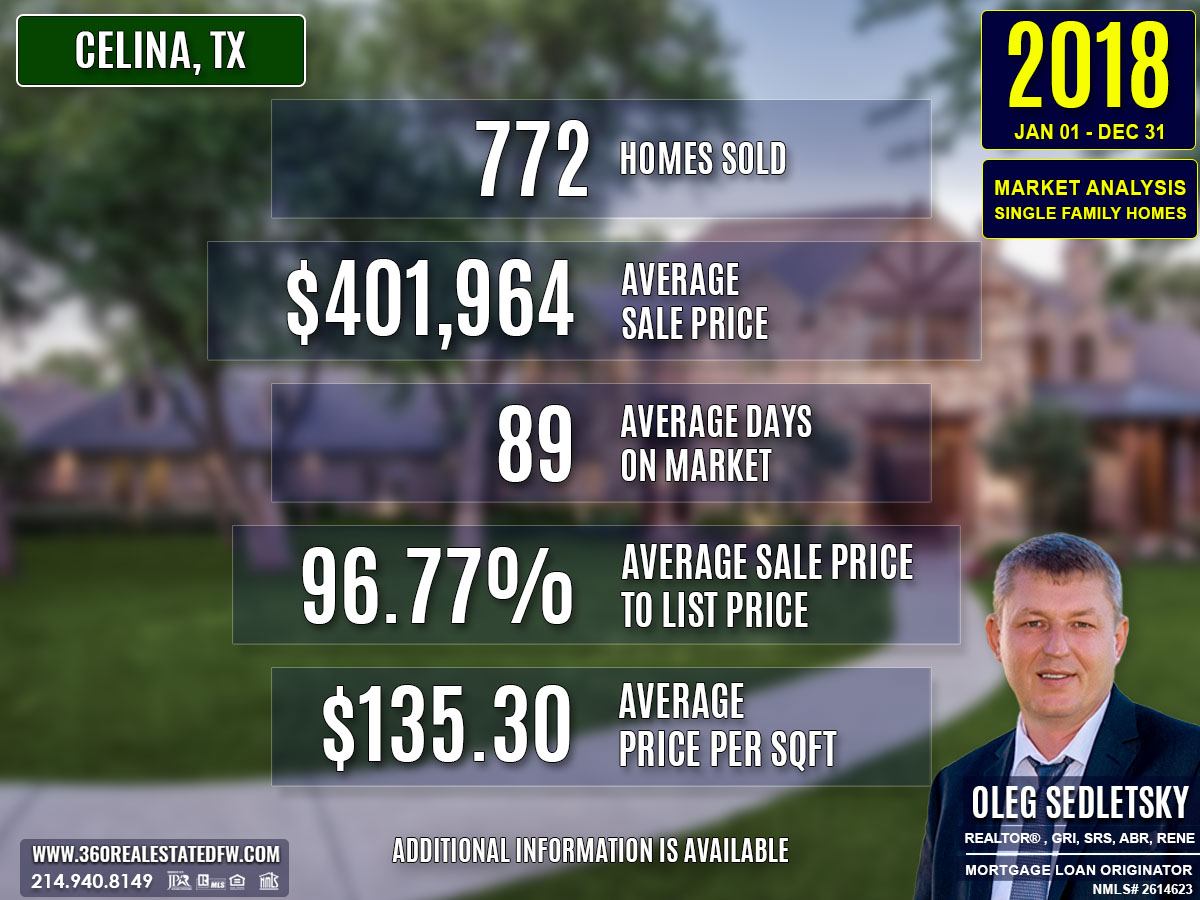
The close price-to-listing price ratio averaged at 96.77%, indicating strong competition, while homes spent slightly more time on the market (89 days on average).
Unique Outliers
A notable outlier was the sale of a $2,000,000 estate distinguished by its expansive acreage and premium amenities. This property offered valuable insight into the preferences and motivations of high-end buyers.
Mortgage Rate Impact
With the average 30-year fixed mortgage rate rising to 4.70%, affordability pressures may have played a role in driving demand for more competitively priced homes.
Total Homes Closed
A total of 772 homes closed during 2018, reflecting a marked growth in sales. New construction homes accounted for a significant portion, with 507 properties, highlighting strong development activity. Additionally, 45 homes with pools sold, showcasing persistent demand for luxury amenities.
Property Pricing Insights
- Minimum Price: $90,000
- Maximum Price: $2,000,000
- Average Price: $401,964
- Median Price: $375,462
The median price reflects a balanced market where most homes fell into the mid-range pricing category, despite high-end outliers.
Property Size and Features
Bedrooms
- Average: 4 bedrooms
- Median: 4 bedrooms
- Range: 2 to 6 bedrooms
Bathrooms
- Average: 3 bathrooms
- Median: 3 bathrooms
- Range: 1 to 8 bathrooms
Square Footage
- Average: 2,981 sqft
- Median: 2,948 sqft
- Range: 713 sqft to 6,811 sqft
Lot Size
- Average: 0.457 acres
- Median: 0.16 acres
- Range: 0.14 acres to 24.495 acres
Market Dynamics
- Average Days on Market (DOM): Homes stayed on the market for an average of 89 days, with some properties experiencing significantly longer listings.
- Close Price to Listing Price (ClsPr/LstPr): Homes sold, on average, for 96.77% of their listing price, demonstrating robust buyer activity and market confidence.
- Average Close Price to Original Listing Price (ClsPr/OLP): The ratio stood at 94.98%, indicating that sellers adjusted expectations in response to market conditions.
- Average Price Per Square Foot: Prices averaged at $135.30 per sqft, signaling a slight but consistent property value appreciation.
Insights into the Most Expensive Celina, TX Property Sold in 2018
The 2018 market’s standout property was a country estate sold for $2,000,000. Situated on a sprawling 18-acre lot, it offered luxury and privacy with unique amenities such as two large ponds, a deep water well, and breathtaking views. Highlights of this property include:
- Price: $2,000,000
- Bedrooms: 4
- Bathrooms: 5 (4 full, 1 half)
- Square Footage: 5,614 sqft
- Price per Square Foot: $356.25/sqft
- Lot Size: 18.091 acres
- Days on Market: 207 days
- ClsPr/LstPr: 81.63%
- ClsPr/OLP: 81.63%
- Year Built: 2005
This estate’s extended time on the market and lower close-to-list ratio reflect the niche demand for ultra-luxury rural properties, which generally attract a smaller buyer pool. However, its eventual sale underscores the potential for high-net-worth transactions in Celina’s evolving market.
Economic context
Average Electricity Costs in Dallas-Fort Worth in 2018
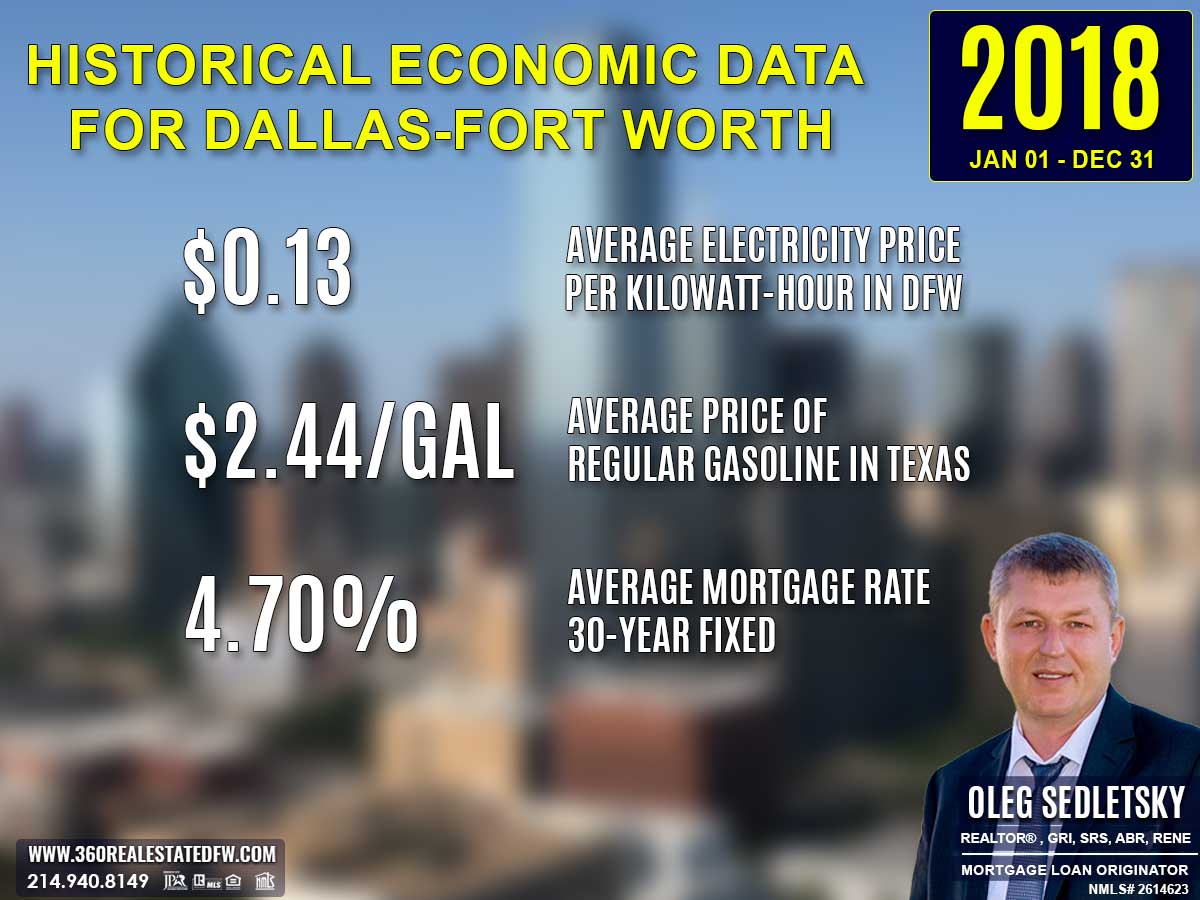
Electricity prices increased to $0.13 per kilowatt-hour in 2018, compared to $0.12 in 2017. This climb likely drove demand for energy-efficient housing and renovations, placing greater emphasis on properties with modern upgrades that helped households manage increasing utility costs.
Average Price for Regular Gasoline in Texas in 2018
Gas prices also rose, reaching $2.44 per gallon in 2018, up from $2.19 in 2017. With transportation becoming more expensive, proximity to workplaces and public transportation remained important for homebuyers. Walkable neighborhoods and mixed-use developments gained traction during this period.
Average 30-Year Fixed Mortgage Rate in 2018
Mortgage rates climbed to 4.70% in 2018, from 4.14% in the previous year. For many homebuyers, this level of interest rate signaled urgency to act before rates increased further. Getting pre-approved by a local mortgage loan originator was pivotal for navigating the pressures of a market increasingly shaped by rising rates.
Curious about today’s mortgage rates and the home you can comfortably afford?
Submit a no-obligation mortgage application today and get pre-approved to determine your budget and take the first step toward homeownership with confidence.
Overview of Differences Between the 2018 and 2017 Real Estate Markets in Celina, Texas
Total Homes Sold
2017: 645
2018: 772
Home sales increased by approximately 19.7%, reflecting stronger market activity and demand in 2018.
Number of Homes with Pools
2017: 49
2018: 45
Sales of homes with pools decreased by about 8.2%, suggesting a shift in buyer preferences or reduced inventory of pool-equipped properties.
Number of New Construction Homes
2017: 386
2018: 507
New construction home sales surged by 31.3%, showcasing strong development activity and buyer interest in modern features.
Average Sales Price
2017: $409,658
2018: $401,964
The average sales price slightly decreased by 1.9%, suggesting that more buyers opted for properties in mid-range price points despite rising interest rates.
Average Days on Market (DOM)
2017: 82 days
2018: 89 days
Homes stayed on the market seven days longer on average in 2018, indicating a more measured pace for transactions.
Average Price Per Square Foot
2017: $133.71
2018: $135.30
The price per square foot rose slightly by 1.2%, reflecting steady property value appreciation despite a marginal dip in average sales prices.
Most Expensive Property Sold
2017: $2,979,900
2018: $2,000,000
The most expensive property sold in 2018 was $979,900 (32.9%) less expensive than in 2017. While the 2017 high-end sale showcased a sprawling 69-acre ranch, the 2018 property offered a smaller 18-acre luxury estate, indicating a tempered luxury market segment.
Summary of Real Estate Market Analysis for Celina, TX in 2018
The 2018 Celina, Texas real estate market was a dynamic and eventful year, characterized by a notable increase in closed sales, robust new construction activity, and steady appreciation in property values. With rising mortgage rates and a diverse range of property options available, the market presented unique opportunities and challenges for buyers and sellers alike.
Homebuyers and First-Time Homebuyers Perspective
For homebuyers, 2018 offered a range of options from competitively priced homes to luxury properties in expansive lots. While the average sales price and mortgage rates were on the rise, the availability of new construction homes presented an appealing opportunity for those seeking modern features. First-time homebuyers faced hurdles with affordability, as rising interest rates tightened budgets. For these buyers, mortgage pre-approval proved essential in improving their purchasing power and competing effectively in a busy market. By being pre-approved, buyers gained a clear understanding of their financial boundaries, streamlining the home search process.
Home-Sellers Perspective
Home-sellers benefited significantly in 2018, with a 96.77% close price-to-list price ratio showcasing strong buyer demand. The growing interest in new construction and homes with value-added amenities like pools highlighted the market’s willingness to invest in unique properties. However, strategic pricing was crucial, especially for high-end homes and niche markets, where extended days on market could affect the property’s perceived value. Sellers who partnered with knowledgeable realtors in Celina and adopted competitive pricing and marketing strategies were able to capitalize on the year’s upward trends effectively.
Final Thoughts
The 2018 real estate market in Celina, TX was a reflection of growth, resilience, and opportunity. While homebuyers contended with rising property values and interest rates, mortgage pre-approval empowered them to make informed decisions. For sellers, the year presented numerous advantages, particularly for those who understood the importance of pricing accurately to attract motivated buyers. Looking ahead, Celina’s evolving landscape and sustained buyer interest indicate a promising future for both buyers and sellers who adapt strategically to the market’s dynamics.
Why Historical Statistical Data Matters in the Celina, Texas Real Estate Market
Did you know that Appraisers and Realtors rely on historical statistical data to determine a property’s current value?
The information presented above is just a small glimpse into the wealth of essential data available to help both homebuyers and sellers set realistic expectations and gain an initial understanding of the real estate market in Celina, Texas. Real estate transactions are intricate, and what you see here is merely a sample of the many factors at play in each deal in this city.
Beyond these insights, a comprehensive analysis is available that focuses on specific aspects like zip codes, neighborhoods, and homes within certain school districts in Celina. This granular data dives deeper into market trends, allowing for a precise understanding of local dynamics. Additionally, historical data plays a critical role in crafting informed strategies, providing the context needed to make confident decisions that align with your goals.
Unlock Exceptional Service!
Assistance with all your real estate needs in the Dallas-Fort Worth area is just a click or call away. Reach out at 214-940-8149 or connect through the links below.
Meet Your Trusted Realtor and Mortgage Expert in Celina, Texas!

Greetings! I’m Oleg Sedletsky, and I’m excited to introduce myself as your go-to full-time licensed Texas REALTOR® and Mortgage Loan Originator.
I proudly represent JPAR® – Real Estate Brokerage as a REALTOR® and Utopia Mortgage LLC as a Mortgage Loan Originator! My designations and certifications reflect my dedication to helping you achieve your real estate goals in CELINA, TX and other locations in the vibrant Dallas-Fort Worth area!
Whether you’re a homebuyer or a home seller, the information on this page highlights just a fraction of what’s important to know about the Celina, TX real estate market. Data like this is key to understanding trends, making informed decisions, and achieving your real estate goals.
The good news? I can provide much more. When you choose me as your real estate agent, you’ll gain access to detailed neighborhood analyses, historical trends, and everything you need to make confident decisions. Whether you’re buying your dream home or securing the best deal on a sale, I’ll guide you every step of the way with peace of mind.
I’d love to be your trusted advisor in this exciting journey. With a commitment to ongoing professional development, I’m always improving to serve you better. Plus, I’m fluent in English, Ukrainian, and Russian and ready to help whenever you’re ready.
If you’re looking for a dedicated, experienced professional, contact me today!
It’s All About You and Your Real Estate Goals!
My mission is to serve you! With my knowledge and expertise, I’m here to help you achieve all your real estate goals!
I’m passionate about helping homebuyers and home-sellers navigate the exciting real estate landscape in Celina, Texas! Whether you’re searching for your dream home, exploring land options, or looking for commercial properties, my Real Estate Services have you covered.
Contact me today for all your real estate needs in Celina, Texas! Call/text 214-940-8149

A Comprehensive Analysis of Single-Family Residential Housing Market in Celina, TX: 2010 to Present
Discover the trends, stats, and insights shaping Celina’s real estate market year by year!
2010-2020
Celina, TX Real Estate Market Report 2010: Analysis and Trends
Celina, TX Real Estate Market Report 2011: Analysis and Trends
Celina, TX Real Estate Market Report 2012: Analysis and Trends
Celina, TX Real Estate Market Report 2013: Analysis and Trends
Celina, TX Real Estate Market Report 2014: Analysis and Trends
Celina, TX Real Estate Market Report 2015: Analysis and Trends
Celina, TX Real Estate Market Report 2016: Analysis and Trends
Celina, TX Real Estate Market Report 2017: Analysis and Trends
Celina, TX Real Estate Market Report 2018: Analysis and Trends
Celina, TX Real Estate Market Report 2019: Analysis and Trends
Celina, TX Real Estate Market Report 2020: Analysis and Trends
This market analysis is intended solely for educational purposes. This market analysis is based on data sourced from NTREIS, Inc. This analysis is exclusively focused on single-family homes and does not account for other property types. The total number of real estate transactions within the specified period and location may vary. Data accuracy cannot be guaranteed due to potential input errors made by NTREIS users. This market analysis does not account for all new construction home sales. If you need detailed information about recorded property sales or other public records, please contact the appropriate city or county office.