
The 2019 real estate market in Prosper, Texas experienced notable growth and shifting dynamics. With 1,089 closed transactions, the market saw increased activity compared to prior years. Property values climbed modestly, while demand for larger homes with unique amenities such as pools remained steady. Developers continued to fuel inventory growth with nearly 580 new construction homes, marking the year as one of robust opportunity for homebuyers and home sellers
Key Takeaways and Trends from the 2019 Real Estate Market in Prosper, TX
1. Pricing Range
Home prices in Prosper ranged widely, with the most affordable property sold at $200,000 and the most expensive reaching $3,044,000. This price diversity reflects the city’s ability to cater to a broad spectrum of buyers.
2. Market Efficiency
The average DOM increased slightly to 93 days, a shift from the faster-paced 83 days in 2018. However, the ClsPr/LstPr ratio remained stable at 96.70%, demonstrating a still-efficient market where most homes sold close to their listed price.
3. Unique Outliers
The luxury sector took the limelight, with a custom-built property on seven acres selling for over $3 million. Features such as a safe room, pool, and 6-car garage offered a glimpse into Prosper’s high-end market segment and buyer preferences.
4. Mortgage Rates Impact
With an average 30-year fixed mortgage rate of 4.13%, slightly lower than 2018, buyers benefited from enhanced affordability. This likely contributed to the increased home sales and property investments in the city.
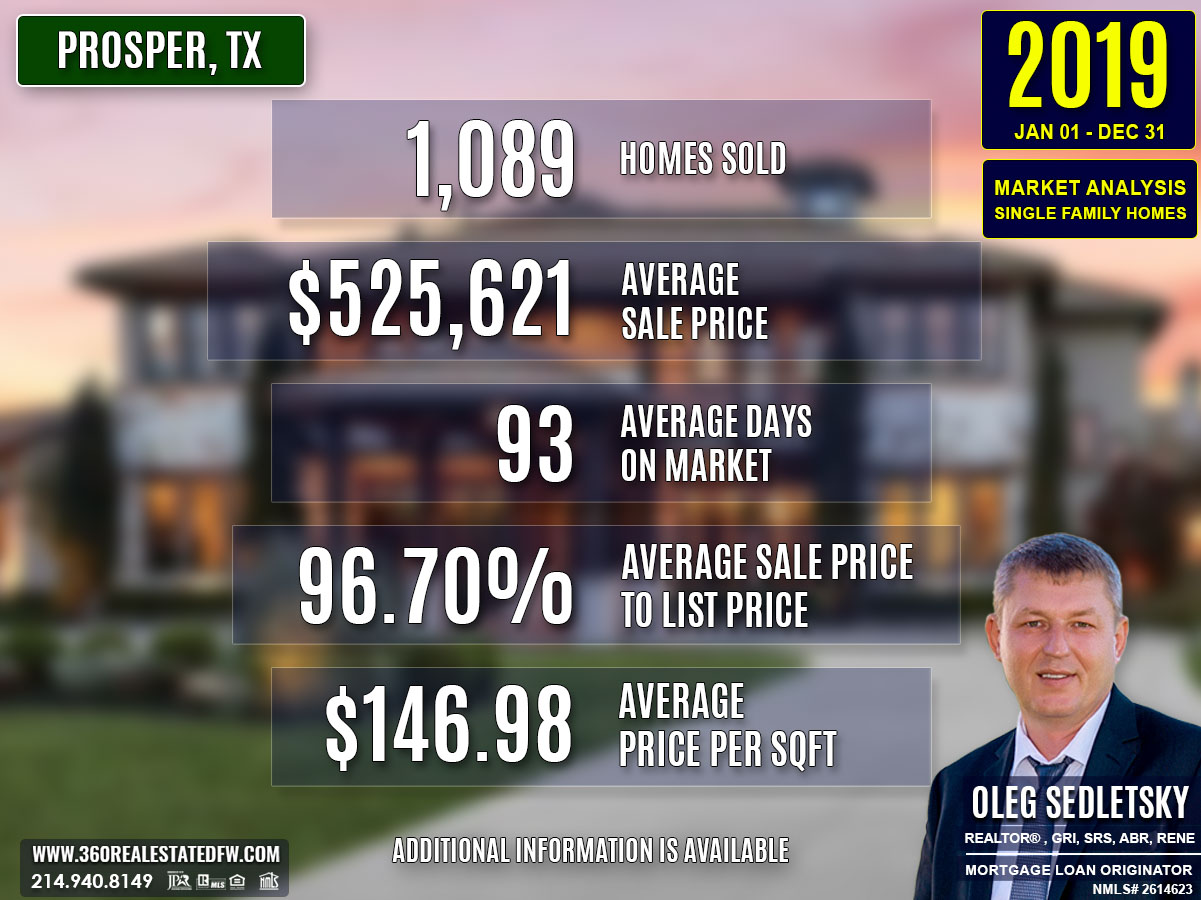
Total Homes Closed
A total of 1,089 residential single-family homes closed in 2019. Of these, 579 were new construction homes, reflecting the city’s ongoing development. Additionally, 150 homes with pools were sold, underscoring the appeal of lifestyle-oriented properties.
Property Pricing Insights
- Minimum Price: $200,000
- Maximum Price: $3,044,000
- Average Price: $525,621
- Median Price: $485,326
This gradual increase in average pricing highlights the sustained value appreciation in Prosper’s real estate market.
Property Size and Features
Homes sold in 2019 featured a mix of layouts and lot sizes:
- Bedrooms: Ranged from 1 to 6
- Bathrooms: 1 to 8, with a mix of full and half-baths
- Square Footage: From 1,091 sq. ft. to 9,016 sq. ft., with an average of 3,551 sq. ft.
- Lot Size varied significantly, with premium lots contributing substantially to a property’s appeal.
These metrics reflect Prosper’s growing inventory of spacious homes designed to align with buyers’ preferences for size and comfort.
Market Dynamics
- Days on Market (DOM): 93 days on average, signaling a balanced market with healthy turnover.
- ClsPr/LstPr Ratio: 96.70%, affirming that sellers priced their homes competitively.
- ClsPr/OLP Ratio: 93.99%, slightly lower than ClsPr/LstPr, likely due to homes with price reductions.
- Average Price per Square Foot: $146.98, showcasing an incremental rise in property values.
Insights into the Most Expensive Prosper, TX Property Sold in 2019
The most expensive property sold in Prosper in 2019 was a unique custom-built home that epitomized luxury and exclusivity.
- Price: $3,044,000
- Beds: 5
- Baths: 7 (5 full, 2 half)
- Square Footage: 9,016 sq. ft.
- Price per Square Foot: $337.62
- Lot Size Area: 7.193 acres
- Days on Market (DOM): 20 days
- ClsPr/LstPr Ratio: 95.57%
- ClsPr/OLP Ratio: 95.57%
- Year Built: 2012
This property boasted amenities like a pool and spa, a tornado shelter, and a 6-car garage with a workshop. Its quick sale in just 20 days, despite the high price tag, demonstrates the strong appeal of unique, feature-rich properties in Prosper’s luxury market.
The sale of this high-value property contributed to raising the average pricing metrics for 2019 and highlighted the continued demand for luxury homes with unmatched amenities. These outliers reinforce the importance of Prosper, TX as a hub for diverse buyer interests.
Economic context
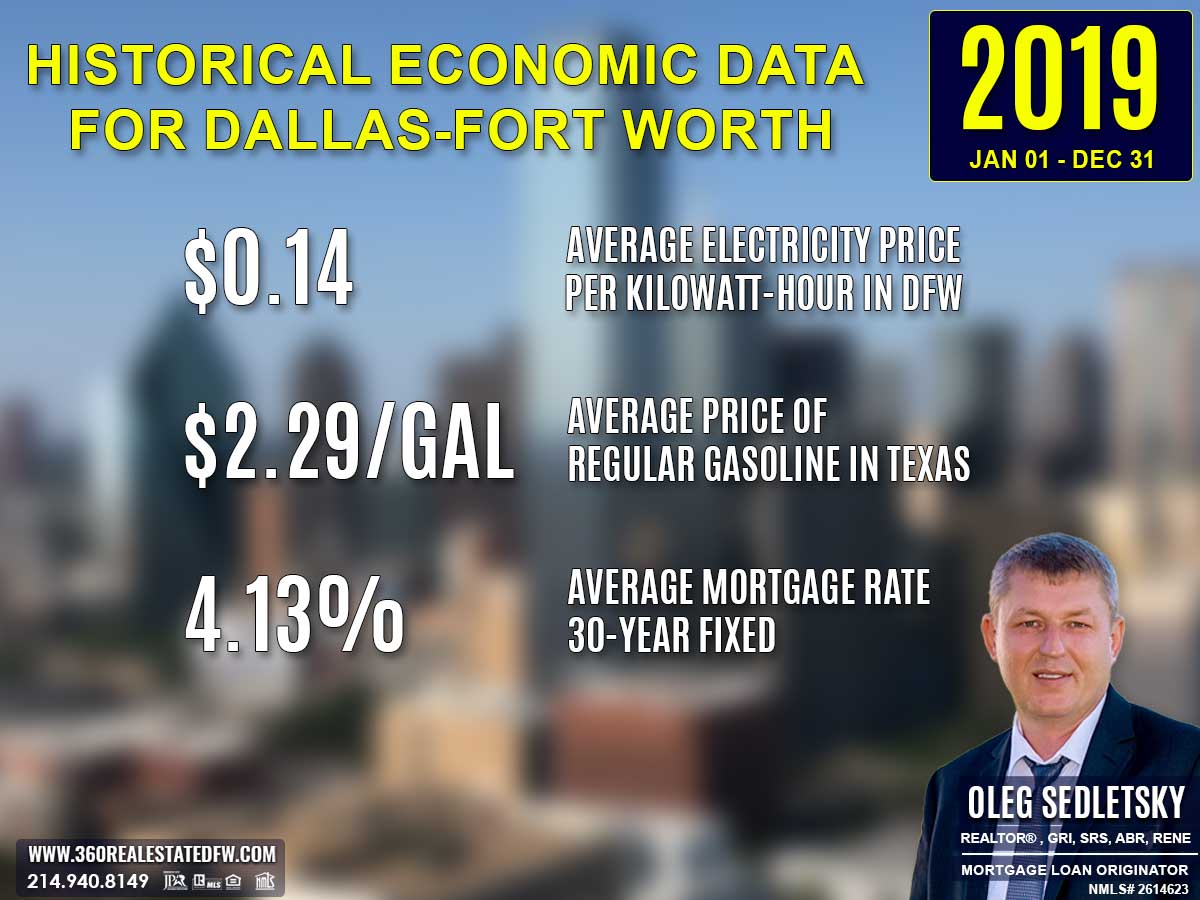
Average Electricity Costs in Dallas-Fort Worth in 2019
The average electricity price in 2019 climbed to $0.14 per kilowatt-hour, up from $0.13 in 2018. This uptick added some pressure on household budgets, further solidifying the need for energy-efficient homes. Properties featuring solar panels or smart home technologies likely gained value as homebuyers sought ways to mitigate rising energy expenses.
Average Price for Regular Gasoline in Texas in 2019
Gas prices fell slightly to $2.29 per gallon in 2019, down from $2.44 in 2018. This small decline brought modest relief to transportation costs and may have encouraged suburban home purchases, where commuting distances tend to be longer. Homebuyers likely balanced fuel costs with home prices when making location decisions.
Average 30-Year Fixed Mortgage Rate in 2019
Mortgage rates averaged 4.13% in 2019, down from 4.70% the year before. This noticeable decline made homeownership more attainable for many homebuyers and likely spurred activity in the housing market. Pre-approvals through local mortgage loan originators remained key for buyers wanting to confidently pursue homes amid favorable rate conditions.
Curious about today’s mortgage rates and the home you can comfortably afford?
Submit a no-obligation mortgage application today and get pre-approved to determine your budget and take the first step toward homeownership with confidence.
Overview of Differences Between the 2018 and 2019 Real Estate Markets in Prosper, Texas
1. Total Homes Sold
2019 recorded 1,089 homes closed, which is an increase of 117 homes compared to 972 in 2018.
2. Average Sales Price
The average sales price rose to $525,621 in 2019, up by $29,948 from $495,673 in 2018, reflecting a continuation of property value growth.
3. Average Price per Square Foot
The average price per square foot increased slightly from $143.23 in 2018 to $146.98 in 2019, showing a modest gain in price per space.
4. Average Days on Market (DOM)
Homes in 2019 spent 93 days on market, which is an uptick of 10 days compared to 83 days in 2018, indicating a slower pace of sales.
5. Close Price to Listing Price (ClsPr/LstPr) Ratio
The ClsPr/LstPr ratio was 96.70% in 2019, slightly higher than 96.26% in 2018, signaling stronger pricing accuracy by sellers.
6. Homes with Pools
Pool-equipped homes saw a slight decline, with 150 sold in 2019, down from 157 in 2018.
7. New Construction Homes
New construction activity gained momentum, rising to 579 homes in 2019, an increase of 55 homes from 524 in 2018.
8. Most Expensive Property Sold
2019: The most expensive property sold for $3,044,000, a custom-built home on 7 acres with 9,016 sq. ft., featuring luxury amenities like a pool, spa, tornado shelter, and 6-car garage.
2018: The top sale was $2,150,000, for a 9,004 sq. ft. home on 3.3 acres, with a pool and scenic views.
The 2019 property not only had a higher sale price but also larger acreage and more premium features, marking an expansion in Prosper’s luxury market.
Summary of Real Estate Market Analysis for Prosper, TX in 2019
The 2019 real estate market in Prosper, Texas showcased vibrant activity with a growing number of transactions, steady price appreciation, and a continued demand for diverse property types. From new construction homes to feature-laden luxury properties, the year reaffirmed Prosper’s versatility as a housing market catering to a wide range of homebuyers and sellers. Stable mortgage rates and a slight increase in Days on Market reflected a balanced market ripe with opportunities for both participants.
Homebuyers and First-Time Homebuyers Perspective
For homebuyers, 2019 underscored the importance of preparation, especially for first-time homebuyers entering an active market. Securing mortgage pre-approval emerged as a crucial step in standing out as a serious buyer and providing clarity on budget constraints. Additionally, working with a knowledgeable realtor became even more essential, not only to identify the best opportunities but also to negotiate effectively in a market where properties were moving steadily. First-time buyers, in particular, benefited from guidance on navigating the complexities of the process, including understanding pricing trends and evaluating properties based on their long-term value.
Home-Sellers Perspective
Home sellers in 2019 leaned heavily on their realtors to craft effective marketing strategies that positioned their properties competitively. From pricing the home right to staging and highlighting unique features, sellers relied on their realtor’s expertise to attract the right buyers. The ability to sell properties close to their listing prices (ClsPr/LstPr at 96.70%) and in reasonable timeframes (93 days on average) demonstrated the impact of well-executed advice and marketing. Market trends also influenced seller decisions, as smaller price reductions and confident pricing strategies reflected the steady buyer demand throughout the year.
Final Thoughts
With Prosper’s diverse offerings and stable market momentum, buyers and sellers alike were able to capitalize on opportunities, paving the way for continued growth in the city’s housing market.
The Importance of Statistical Data in Prosper, Texas Real Estate Market
Did you know that Appraisers and Realtors rely on historical statistical data to determine a property’s current value?
The data above is just the beginning. This glimpse into the Prosper, Texas real estate market outlines trends but doesn’t capture the full picture. To truly understand the city’s housing market, you’ll need specific insights like zip code analyses, neighborhood breakdowns, and school-district-focused data. Historical trends and comprehensive analyses arm both homebuyers and home sellers with the tools they need to make decisions confidently.
The insights on this page represent just a small part of the comprehensive real estate services I provide to my clients. Whether you’re a buyer aiming to find your dream home or a seller looking to maximize your property’s value, I provide data-backed strategies tailored to your goals.
Reach out today—I’d love to help you achieve success in Prosper’s vibrant housing market!
Unlock Exceptional Service!
Assistance with all your real estate needs in the Dallas-Fort Worth area is just a click or call away. Reach out at 214-940-8149 or connect through the links below.
Meet Your Trusted Realtor and Mortgage Expert in Prosper, Texas!

Oleg Sedletsky REALTOR® in Prosper, Texas. Call/Text 214.940.8149
Greetings! I’m Oleg Sedletsky, and I’m excited to introduce myself as your go-to full-time licensed Texas REALTOR® and Mortgage Loan Originator.
I proudly represent JPAR® – Real Estate Brokerage as a REALTOR® and Utopia Mortgage LLC as a Mortgage Loan Originator! My designations and certifications reflect my dedication to helping you achieve your real estate goals in Prosper, TX and other locations in the vibrant Dallas-Fort Worth area!
With my expertise, I’ll provide you with in-depth resources, including detailed market reports and historical data, to help you make confident, well-informed decisions. Fluent in English, Ukrainian, and Russian, I’m here to guide you through every step of the process with personalized support and dedication.
It’s All About You and Your Real Estate Goals!
My mission is to serve you! With my knowledge and expertise, I’m here to help you achieve all your real estate goals!
I’m passionate about helping homebuyers and home-sellers navigate the exciting real estate landscape in Prosper, Texas! Whether you’re searching for your dream home, exploring land options, or looking for commercial properties, my Real Estate Services have you covered.
Contact me today for all your real estate needs in Prosper, Texas! Call/text 214-940-8149

A Comprehensive Analysis of Single-Family Residential Housing Market in Prosper, TX: 2010 to Present
Discover the trends, stats, and insights shaping Prosper’s real estate market year by year!
2010-2020
Prosper, TX Real Estate Market Report 2010: Analysis and Trends
Prosper, TX Real Estate Market Report 2011: Analysis and Trends
Prosper, TX Real Estate Market Report 2012: Analysis and Trends
Prosper, TX Real Estate Market Report 2013: Analysis and Trends
Prosper, TX Real Estate Market Report 2014: Analysis and Trends
Prosper, TX Real Estate Market Report 2015: Analysis and Trends
Prosper, TX Real Estate Market Report 2016: Analysis and Trends
Prosper, TX Real Estate Market Report 2017: Analysis and Trends
Prosper, TX Real Estate Market Report 2018: Analysis and Trends
Prosper, TX Real Estate Market Report 2019: Analysis and Trends
Prosper, TX Real Estate Market Report 2020: Analysis and Trends
This market analysis is intended solely for educational purposes. This market analysis is based on data sourced from NTREIS, Inc. This analysis is exclusively focused on single-family homes and does not account for other property types. The total number of real estate transactions within the specified period and location may vary. Data accuracy cannot be guaranteed due to potential input errors made by NTREIS users. This market analysis does not account for all new construction home sales. If you need detailed information about recorded property sales or other public records, please contact the appropriate city or county office.