
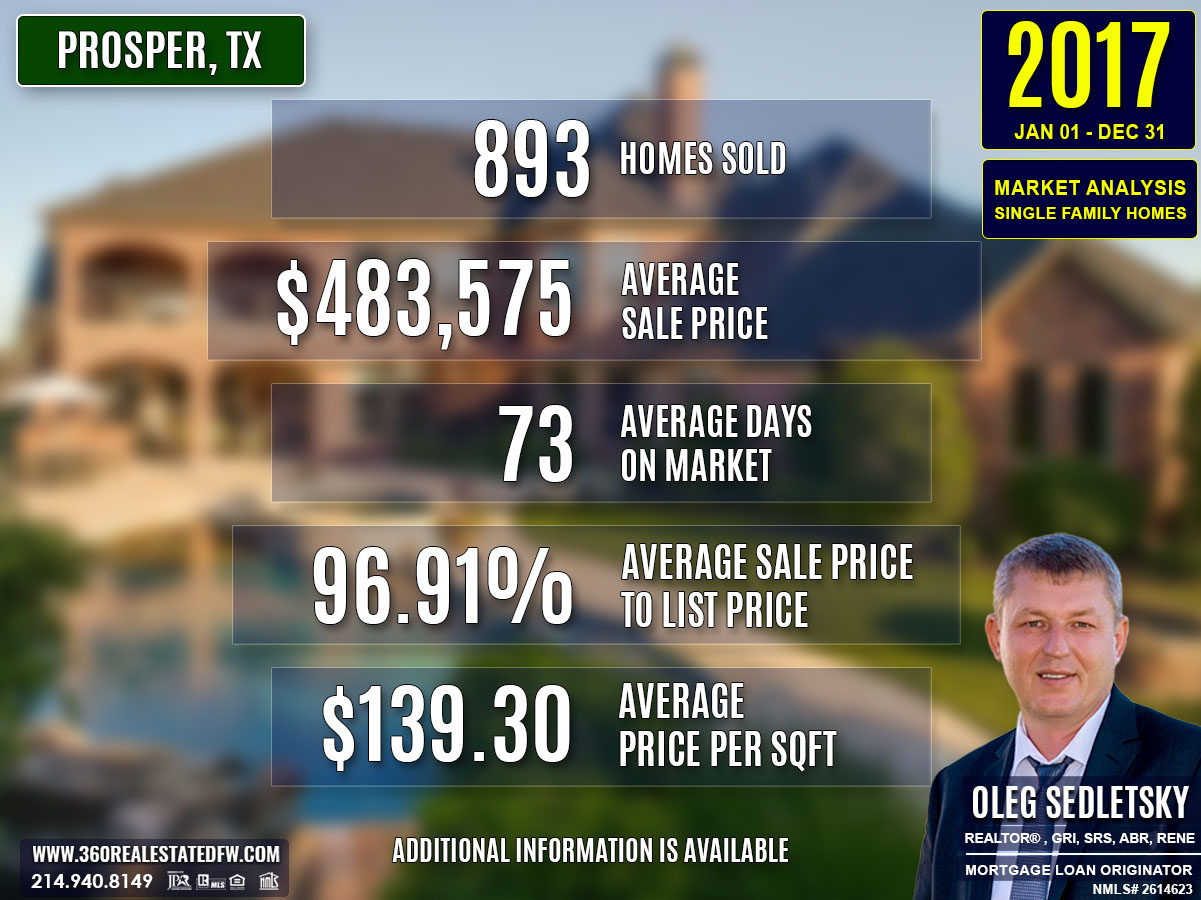
The year 2017 proved to be an active and dynamic period for the residential single-family home market in Prosper, Texas. With 893 properties closed, the market displayed varied pricing, efficient sales cycles, and increasing demand for both new builds and unique property features such as swimming pools. This analysis dives into the key metrics and trends that shaped the local real estate market, providing a closer look at pricing, property characteristics, market efficiency, and notable highlights.
Key Takeaways and Trends from the 2017 Real Estate Market in Prosper, TX
1. Pricing Range
The sales prices for residential homes ranged from $185,000 to $1,615,000, with an average of $483,575. This wide range reflects the availability of homes catering to different budgets, from modest dwellings to luxury properties.
2. Market Efficiency
The market demonstrated strong efficiency based on a close price to listing price average of 96.91% and an average DOM of 73. Homes sold quickly, aligning closely with their listing values, suggesting active buyer interest and accurate pricing by sellers.
3. Unique Outliers
The standout property of the year was a luxury two-story home with 8,477 square feet, priced at $1,615,000. Unique features such as a tornado shelter, slate balconies, and a beach entry pool set it apart, significantly influencing the upper boundaries of the market.
4. Mortgage Rates Impact
With an average 30-year fixed mortgage rate of 4.14%, borrowing costs remained moderate in 2017. This favorable rate encouraged buyers to invest, contributing to market movement and demand stability.
Total Homes Closed
A total of 893 properties were sold in 2017, reflecting a strong local market. Among these, 116 homes featured pools, highlighting the appeal of leisure-oriented amenities. Additionally, 448 newly constructed homes were sold, representing just over half of the total sales, signaling a high demand for modern-built properties.
Property Pricing Insights
- Minimum Price: $185,000
- Maximum Price: $1,615,000
- Average Price: $483,575
- Median Price: $450,000
The market catered to a wide range of buyers, with prices skewed slightly toward new and modern builds, as reflected in the median price of $450,000.
Property Size and Features
- Bedrooms: Ranged from 2 to 6 (average 4)
- Bathrooms: Ranged from 1 to 8 (average 4, with 3 full baths as the median)
- Square Footage: From 876 to 8,477 sq. ft. (average 3,470 sq. ft., median 3,501)
- Lot Size Area: Varied from .000 to 9.08 acres
The data reveals that the majority of homes were midsize, featuring 4 bedrooms and 4 bathrooms on average, with lot sizes varying drastically. Larger luxury homes contributed to upper pricing brackets.
Market Dynamics
- Days on Market (DOM): The average DOM was 73, indicating properties were sold relatively quickly. The median DOM of 49 days further signals that well-priced homes moved rapidly.
- Close Price to Listing Price Ratio (ClsPr/LstPr): At an average of 96.91%, homes typically closed near their original listing prices, showcasing market stability.
- Close Price to Original Listing Price Ratio (ClsPr/OLP): Averaging 94.96%, this metric suggests some price adjustments were made in the market but were not overly significant.
- Average Price per Square Foot: $139.30
Insights into the Most Expensive Prosper, TX Property Sold in 2017
The most expensive home sold in 2017 was a luxurious two-story property with a slew of premium amenities and features. Highlights of the property include:
- Price: $1,615,000
- Beds and Baths: 5 bedrooms, 7 bathrooms (4 full, 3 half)
- Size: 8,477 sq. ft.
- Price per Square Foot: $190.52
- Lot Size: 1.219 acres
- Days on Market (DOM): 284
- ClsPr/LstPr Ratio: 95.01%
- ClsPr/OLP Ratio: 87.30%
- Year Built: 2005
- Unique Features: Tornado shelter, two balconies with slate finishes, and a beach entry pool
Despite its extended time on the market (284 days), this property showcased the cache for high-end residences in Prosper, TX. Its sale influenced the upper spectrum of the market, setting a precedent for luxury pricing and boosting market visibility for similar high-value properties.
Economic context
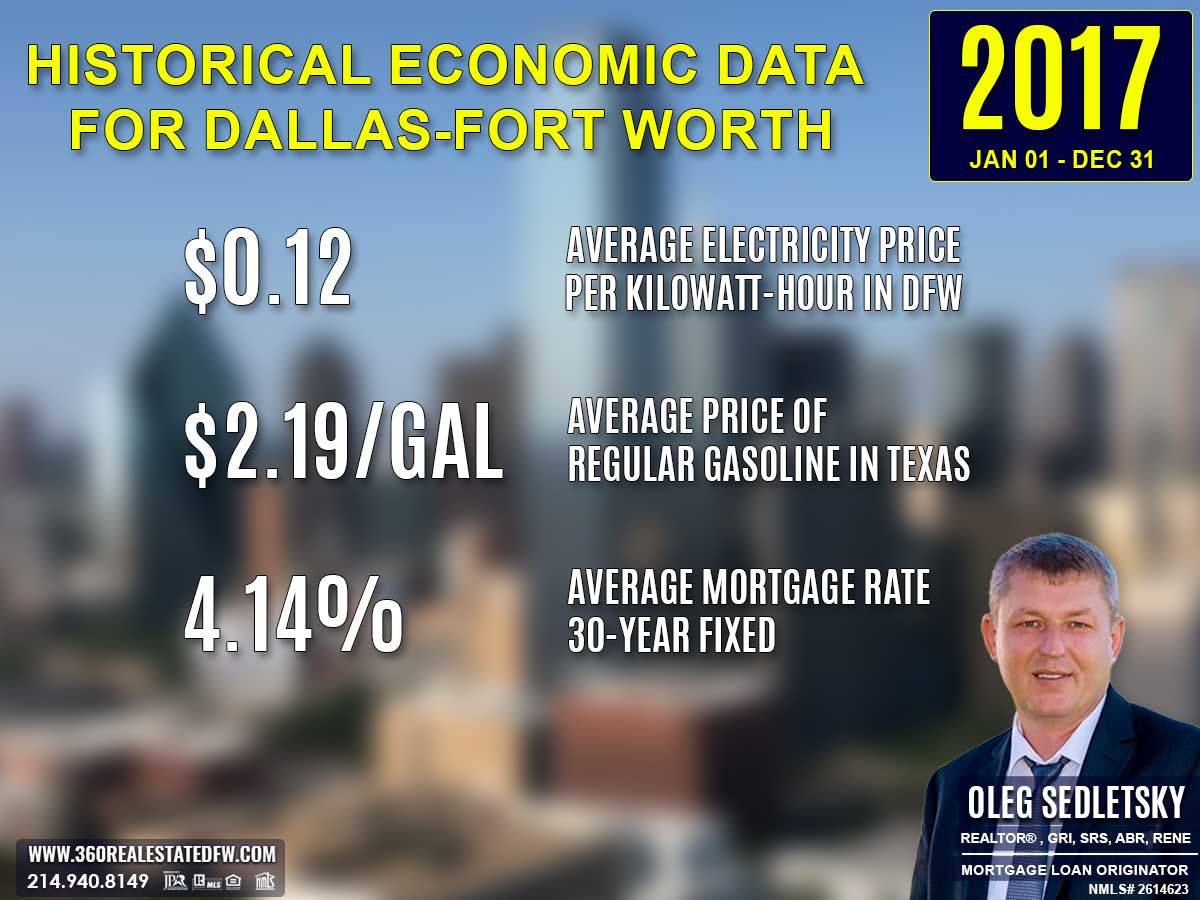
Average Electricity Costs in Dallas-Fort Worth in 2017
Electricity prices rose to $0.12 per kilowatt-hour in 2017, after a year at $0.11. This small uptick likely reignited interest in smaller homes or energy-efficient features. homebuyers remained cautious about properties with older energy systems, viewing them as less desirable long-term investments.
Average Price for Regular Gasoline in Texas in 2017
Gas prices increased to $2.19 per gallon in 2017, up from $1.91 in 2016. While still relatively affordable, the rise may have led homebuyers to reconsider the financial trade-offs of suburban living. Proximity to public transportation hubs became a more significant factor during housing searches.
Average 30-Year Fixed Mortgage Rate in 2017
Mortgage rates rose to 4.14% in 2017, up from 3.79% the year prior. The return of higher rates reminded homebuyers of the importance of locking in favorable financing terms early. Pre-approval through local mortgage loan originators remained vital to navigating the shifting landscape effectively and with confidence.
Curious about today’s mortgage rates and the home you can comfortably afford?
Submit a no-obligation mortgage application today and get pre-approved to determine your budget and take the first step toward homeownership with confidence.
Overview of Differences Between the 2016 and 2017 Real Estate Markets in Prosper, Texas
The real estate market in Prosper, Texas showed notable growth and changes from 2016 to 2017. Here’s a summary of the key differences and trends:
1. Total Homes Sold:
2016 saw 732 closed residential single-family home sales, while 2017 experienced a significant increase to 893 homes sold. This marks an uptick of 161 transactions, suggesting heightened market activity and buyer demand.
2. Average Sales Price:
The average sales price rose modestly from $470,432 in 2016 to $483,575 in 2017, reflecting a steady increase in property values. This growth indicates a robust market with rising property demand and prices.
3. Average Days on Market (DOM):
The average DOM slightly increased from 69 days in 2016 to 73 days in 2017. This minor shift suggests properties were moving at a similar pace, maintaining market efficiency year-over-year.
4. Average Price Per Square Foot:
The average price per square foot climbed from $132.90 in 2016 to $139.30 in 2017, showcasing a continued upward trend in the value of residential real estate.
5. Homes with Pools:
The number of homes sold with pools rose from 100 in 2016 to 116 in 2017, aligning with the increased overall sales volume and a potential growing preference for homes with recreational features.
6. New Construction Homes:
There was a sharp rise in new construction home sales, jumping from 339 in 2016 to 448 in 2017. This boost reflects increased development activity and a strong demand for modern, updated properties.
Most Expensive Property Sold Comparison
2016: The most expensive property sold was listed at $1,850,000, offering 5 beds, 7 baths, 7,904 square feet, and unique features such as guest quarters (Casita) and an outdoor paradise with patios, a fireplace, and a pool/spa. It closed at $234.06 per square foot.
2017: The priciest home sold for $1,615,000 with 5 beds, 7 baths, 8,477 square feet, including high-end features like a tornado shelter, two slate-covered balconies, and a beach-entry pool. It closed at $190.52 per square foot.
While 2017’s most expensive property had a larger square footage, the lower closing price and price per square foot compared to 2016 suggest a possible shift in the luxury segment or market preferences.
Economic Factors
Average 30-year fixed mortgage rates increased from 3.79% in 2016 to 4.14% in 2017. This rise in borrowing costs could have impacted buyers’ purchasing power, though the market remained active.
Gas prices and electricity costs also rose slightly, which might have influenced operating costs or buyer decisions indirectly.
Market Evolution
The real estate market in Prosper, TX demonstrated resilience and growth, with a significant increase in total transactions and property values. The rise in new construction home sales indicates a shift toward modern housing options, while the demand for homes with pools saw steady growth. Slight increases in mortgage rates and utility costs did not deter buyer activity, showcasing a strong and adaptable market. Overall, the year-over-year comparison reveals a maturing real estate market with expanded opportunities for both buyers and sellers.
Summary of Real Estate Market Analysis for Prosper, TX in 2017
The 2017 real estate market in Prosper, TX painted a picture of opportunity and activity. With a total of 893 homes sold, the market was shaped by strong buyer interest, efficient property sales, and a wide pricing range. Both established and first-time buyers found options across various price points, while sellers experienced notable success thanks to strategic pricing and marketing. The year offered balanced momentum for all participants, cementing Prosper’s real estate market as both dynamic and stable.
Homebuyers and First-Time Homebuyers Perspective
For homebuyers, 2017 provided a variety of choices, with prices starting at $185,000 and reaching as high as $1,615,000. The availability of new construction homes was particularly attractive, allowing buyers to target modern builds with updated features. First-time homebuyers benefited from moderate mortgage rates averaging 4.14%, which made the process more financially accessible. The market’s efficiency, as reflected in the average close price to listing price ratio of 96.91%, gave buyers confidence that they were entering a fair and stable environment. Above all, the options available in bedroom and bathroom configurations, as well as lot sizes, allowed buyers to find homes that matched their lifestyles and needs.
Home-Sellers Perspective
For Home Sellers, the market in 2017 underscored the importance of positioning properties competitively. The median days on market (49) and close price to listing price ratio (96.91%) signal that well-priced homes moved quickly and with minimal negotiation. Sellers largely relied on their realtors’ expertise, whether through strategic pricing advice, professional photography to showcase homes, or marketing techniques to attract the right buyers. Realtors played a pivotal role in navigating the complexities of the home selling process, ensuring that homes were not only visible to prospective buyers but also aligned with market trends. Seller confidence was reflected in the overall market dynamics, where even high-end properties found buyers willing to invest.
Final Thoughts
The 2017 residential market in Prosper, Texas demonstrated a healthy balance between buyers’ needs and sellers’ expectations. Favorable mortgage rates played a significant role in encouraging steady buyer activity, while sellers leveraged professional support to achieve favorable outcomes. The market’s diversity in pricing, property types, and features catered to a wide demographic, from first-time buyers seeking affordability to seasoned homeowners pursuing luxury. This balance of supply and demand, coupled with market stability, marked 2017 as a successful year for real estate in Prosper, Texas, setting a strong foundation for the years to come.
The Importance of Statistical Data in Prosper, Texas Real Estate Market
Did you know that Appraisers and Realtors rely on historical statistical data to determine a property’s current value?
The data above is just the beginning. This glimpse into the Prosper, Texas real estate market outlines trends but doesn’t capture the full picture. To truly understand the city’s housing market, you’ll need specific insights like zip code analyses, neighborhood breakdowns, and school-district-focused data. Historical trends and comprehensive analyses arm both homebuyers and home sellers with the tools they need to make decisions confidently.
The insights on this page represent just a small part of the comprehensive real estate services I provide to my clients. Whether you’re a buyer aiming to find your dream home or a seller looking to maximize your property’s value, I provide data-backed strategies tailored to your goals.
Reach out today—I’d love to help you achieve success in Prosper’s vibrant housing market!
Unlock Exceptional Service!
Assistance with all your real estate needs in the Dallas-Fort Worth area is just a click or call away. Reach out at 214-940-8149 or connect through the links below.
Meet Your Trusted Realtor and Mortgage Expert in Prosper, Texas!

Oleg Sedletsky REALTOR® in Prosper, Texas. Call/Text 214.940.8149
Greetings! I’m Oleg Sedletsky, and I’m excited to introduce myself as your go-to full-time licensed Texas REALTOR® and Mortgage Loan Originator.
I proudly represent JPAR® – Real Estate Brokerage as a REALTOR® and Utopia Mortgage LLC as a Mortgage Loan Originator! My designations and certifications reflect my dedication to helping you achieve your real estate goals in Prosper, TX and other locations in the vibrant Dallas-Fort Worth area!
With my expertise, I’ll provide you with in-depth resources, including detailed market reports and historical data, to help you make confident, well-informed decisions. Fluent in English, Ukrainian, and Russian, I’m here to guide you through every step of the process with personalized support and dedication.
It’s All About You and Your Real Estate Goals!
My mission is to serve you! With my knowledge and expertise, I’m here to help you achieve all your real estate goals!
I’m passionate about helping homebuyers and home-sellers navigate the exciting real estate landscape in Prosper, Texas! Whether you’re searching for your dream home, exploring land options, or looking for commercial properties, my Real Estate Services have you covered.
Contact me today for all your real estate needs in Prosper, Texas! Call/text 214-940-8149

A Comprehensive Analysis of Single-Family Residential Housing Market in Prosper, TX: 2010 to Present
Discover the trends, stats, and insights shaping Prosper’s real estate market year by year!
2010-2020
Prosper, TX Real Estate Market Report 2010: Analysis and Trends
Prosper, TX Real Estate Market Report 2011: Analysis and Trends
Prosper, TX Real Estate Market Report 2012: Analysis and Trends
Prosper, TX Real Estate Market Report 2013: Analysis and Trends
Prosper, TX Real Estate Market Report 2014: Analysis and Trends
Prosper, TX Real Estate Market Report 2015: Analysis and Trends
Prosper, TX Real Estate Market Report 2016: Analysis and Trends
Prosper, TX Real Estate Market Report 2017: Analysis and Trends
Prosper, TX Real Estate Market Report 2018: Analysis and Trends
Prosper, TX Real Estate Market Report 2019: Analysis and Trends
Prosper, TX Real Estate Market Report 2020: Analysis and Trends
This market analysis is intended solely for educational purposes. This market analysis is based on data sourced from NTREIS, Inc. This analysis is exclusively focused on single-family homes and does not account for other property types. The total number of real estate transactions within the specified period and location may vary. Data accuracy cannot be guaranteed due to potential input errors made by NTREIS users. This market analysis does not account for all new construction home sales. If you need detailed information about recorded property sales or other public records, please contact the appropriate city or county office.