
The 2017 real estate market in Princeton, Texas showed strong growth, driven by rising home prices, faster sales, and heightened activity in new construction and premium properties. This analysis dives into sales trends, pricing, property features, and market dynamics in Princeton for a deeper understanding of the year’s real estate landscape.
Key Takeaways and Trends from Princeton’s 2017 Real Estate Market
Pricing Range: Homes ranged from $62,000 to $540,000, offering products for both new homebuyers and luxury-seeking clients. Mid-market pricing rose steadily, bolstering confidence in the upper middle class.
Market Efficiency: Sales efficiency slightly slowed, with homes taking a few days longer to sell compared to the prior year.
Unique Outliers: With overbidding anomalies in ClsPr/OLP ratios and densifying developments, 2017 saw continued shifts in inventory makeup.
Mortgage Rates Impact: Higher average mortgage rates of 4.14%, up from 3.79% in 2016, slightly dampened affordability but didn’t heavily deter homebuyers.
Total Homes Closed
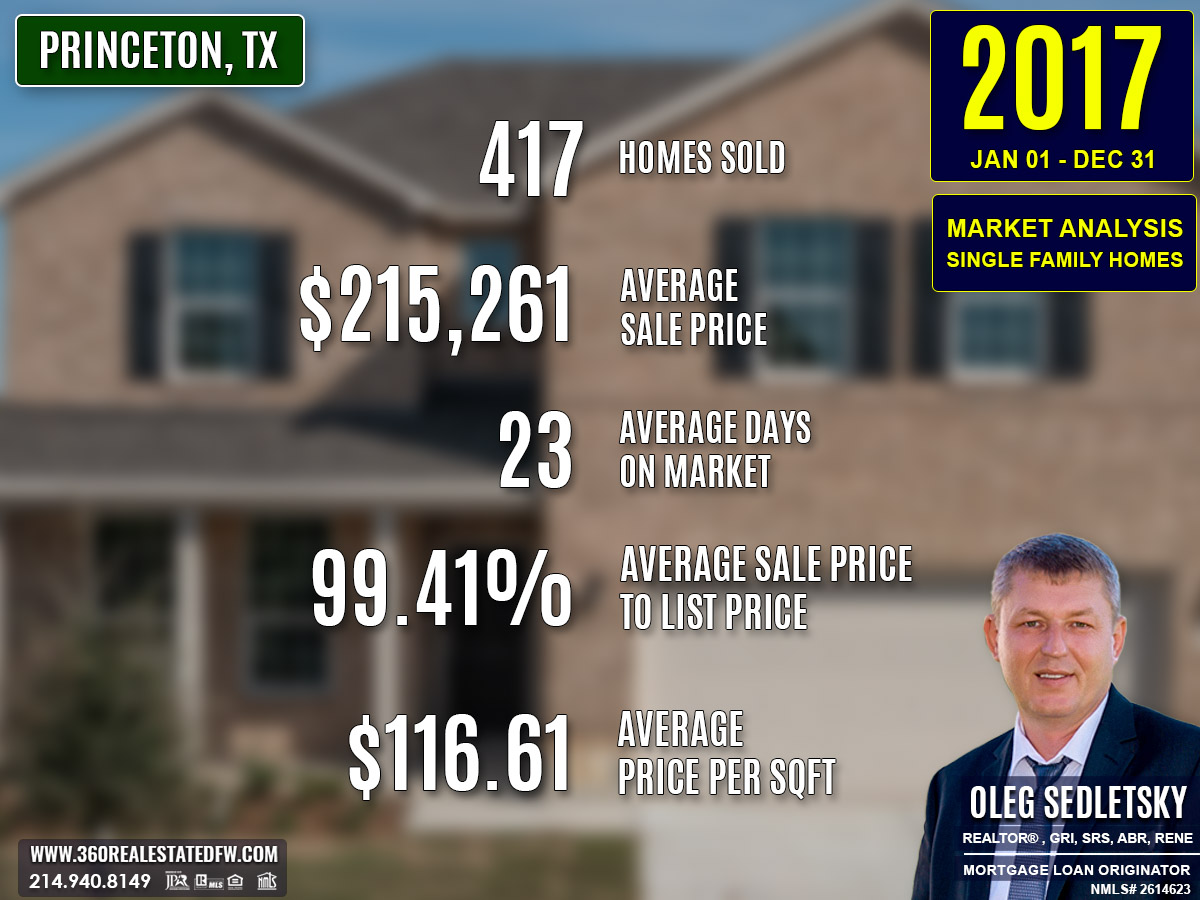
- Closed transactions: A total of 417 homes sold, a notable increase from 351 in 2016.
- New construction homes: 187 properties, indicating a booming construction sector and rising demand for new developments.
- Homes with pools: Only 6 homes sold with pools, a drop from 12 in 2016, signaling shifting preferences or availability.
Property Pricing Insights
The pricing metrics for 2017 reflect upward trends across the board:
- Minimum price: Dropped slightly to $62,000 from $65,000 in 2016, providing accessibility to budget homebuyers.
- Maximum price: Slightly decreased from $559,700 to $540,000, driven by a shift in luxury segment transactions.
- Average price: Rose 7.7% to $215,261, up from $199,966.
- Median price: Climbed to $215,900, representing an 11.3% increase from $194,000, emphasizing growth in the mid-market range.
Property Size and Features
The 2017 market offered a diverse range of home sizes catering to different buyer needs:
- Bedrooms: Typically 4 bedrooms, steady compared to 2016.
- Bathrooms: Averaged 2 bathrooms, but some homes included up to 5 bathrooms.
- Square footage: Ranged from 720 sqft to 3,799 sqft, maintaining the same average of 1,882 sqft as in 2016.
- Lot sizes: Averaged 0.361 acres, smaller compared to 0.470 acres in 2016, pointing to increasingly denser developments.
Market Dynamics
The overall efficiency of the market improved in 2017, helping sustain competitive conditions:
- Days on Market (DOM): Homes sold in an average of 23 days, slightly higher than the 20-day average in 2016, but still strong.
- ClsPr/LstPr Ratio: Improved marginally to 99.41%, up from 99.53%, sustaining tight seller-buyer negotiations.
- ClsPr/OLP Ratio: Surprisingly spiked to 134.60% from 98.90%, driven by anomalies in overbids and new construction premiums.
- Average price per sqft: Increased to $116.61, a significant 8.4% rise from $107.59 in 2016, showcasing higher property value per unit area.
Insights into the Most Expensive Princeton, TX Property Sold in 2017
The year’s priciest sale was a grand estate with standout features and a remarkable price tag:
- Price: $540,000
- Beds/Baths: 5 bedrooms, 4 bathrooms (3 full, 1 half)
- Square Footage: 3,354 sqft
- Price per sqft: $161.00
- Lot Size: 10 acres
- Days on Market (DOM): 61 days
- ClsPr/LstPr Ratio: 98.20%
- ClsPr/OLP Ratio: 98.20%
- Year Built: 1996
- Unique Feature: Pool with scenic acreage
This sale highlights the continued strength of Princeton’s luxury market, with large, high-end estates maintaining appeal among premium buyers. Its extended DOM reflects the selectiveness of this buyer segment.
Economic context
Average Electricity Costs in Dallas-Fort Worth in 2017
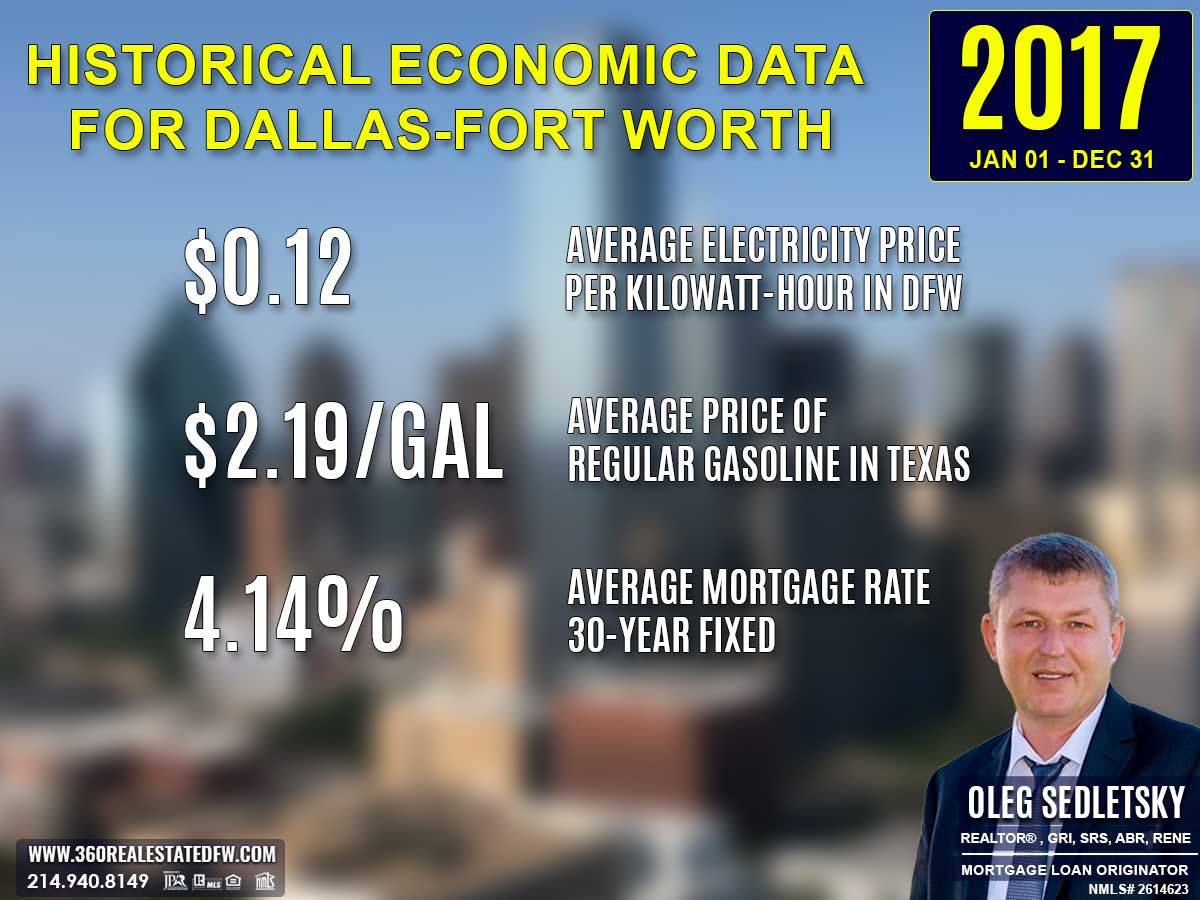
Electricity prices rose to $0.12 per kilowatt-hour in 2017, after a year at $0.11. This small uptick likely reignited interest in smaller homes or energy-efficient features. homebuyers remained cautious about properties with older energy systems, viewing them as less desirable long-term investments.
Average Price for Regular Gasoline in Texas in 2017
Gas prices increased to $2.19 per gallon in 2017, up from $1.91 in 2016. While still relatively affordable, the rise may have led homebuyers to reconsider the financial trade-offs of suburban living. Proximity to public transportation hubs became a more significant factor during housing searches.
Average 30-Year Fixed Mortgage Rate in 2017
Mortgage rates rose to 4.14% in 2017, up from 3.79% the year prior. The return of higher rates reminded homebuyers of the importance of locking in favorable financing terms early. Pre-approval through local mortgage loan originators remained vital to navigating the shifting landscape effectively and with confidence.
Curious about today’s mortgage rates and the home you can comfortably afford?
Submit a no-obligation mortgage application today and get pre-approved to determine your budget and take the first step toward homeownership with confidence.
Overview of Differences Between the 2016 and 2017 Real Estate Markets in Princeton, Texas
Volume of Sales
Home sales increased by 18.8%, rising from 351 in 2016 to 417 in 2017, reflecting greater buyer activity.
Pricing
- Minimum price: Decreased slightly from $65,000 to $62,000, offering opportunities for budget buyers.
- Maximum price: Dropped modestly from $559,700 to $540,000, affecting the luxury segment.
- Average price: Rose 7.7%, from $199,966 to $215,261, signaling price growth across the market.
- Median price: Increased by 11.3%, from $194,000 to $215,900, emphasizing mid-market strength.
Market Efficiency
- Days on Market (DOM): Increased slightly from 20 to 23 days, showing a small slowdown in turnover.
- ClsPr/LstPr Ratio: Remained stable at around 99.5%, showcasing continued tight negotiations.
- ClsPr/OLP Ratio: Drastically spiked from 98.90% to 134.60%, influenced by outliers and overbidding in some properties.
Property Features
- Square footage: Remained consistent, averaging 1,882 sqft both years.
- Lot size: Declined in average from 0.470 acres to 0.361 acres, indicating more compact developments.
- Homes with pools: Dropped by half, from 12 in 2016 to 6 in 2017, likely due to supply changes.
- New construction homes: Increased by 37.5%, from 136 to 187, highlighting strong growth in newly built properties.
Economic Context
- Mortgage rates: Rose from 3.79% to 4.14%, potentially impacting affordability.
- Gas prices: Increased from $1.91 to $2.19 per gallon, and electricity costs rose from $0.11 to $0.12 per kilowatt hour, slightly elevating living expenses.
The 2017 market displayed a healthy increase in sales volume, higher overall pricing, robust new construction growth, and slightly slower market turnover, despite economic headwinds of rising costs and interest rates.
Summary of Real Estate Market Analysis for Princeton, TX in 2017
The 2017 real estate market in Princeton, Texas reinforced its upward trajectory, boasting increased sales, higher prices, and steady demand for new construction homes. Despite higher costs tied to loans and utilities, the market achieved sustained growth, driven by responsive developments and competitive buyer activity. Looking ahead, the market’s upward trend reflects a healthy balance of affordability and aspirational inventory, setting the tone for continued performance in 2018.
The Importance of Statistical Data in Princeton, Texas Real Estate Market
Did you know that appraisers and Realtors rely on historical statistical data to determine a property’s current value?
Analyzing historical market data is essential for making informed decisions in today’s real estate market. Examining past trends provides valuable insights that facilitate accurate pricing, more strategic negotiations, and a comprehensive understanding of market dynamics. By understanding market dynamics, both homebuyers and home-sellers can leverage the conditions to achieve their goals.
Unlock Exceptional Service!
Assistance with all your real estate needs in the Dallas-Fort Worth area is just a click or call away. Reach out at 214-940-8149 or connect through the links below.

Oleg Sedletsky REALTOR® in Princeton, Texas. Call/Text 214.940.8149
Greetings! I’m Oleg Sedletsky, and I’m excited to introduce myself as your go-to full-time licensed Texas REALTOR® and Mortgage Loan Originator.
I proudly represent JPAR® – Real Estate Brokerage as a REALTOR® and Utopia Mortgage LLC as a Mortgage Loan Originator! My designations and certifications reflect my dedication to helping you achieve your real estate goals in Princeton, TX and other locations in the vibrant Dallas-Fort Worth area!
My commitment to ongoing professional development means I’m always enhancing my skills to serve you better. You can count on me as your trusted expert throughout your real estate journey. Plus, I’m fluent in English, Ukrainian, and Russian and ready to assist you every step of the way!
It’s All About You and Your Real Estate Goals!
My mission is to serve you! With my knowledge and expertise, I’m here to help you achieve all your real estate goals!
I’m passionate about helping buyers and sellers navigate the exciting real estate landscape in Princeton, Texas! Whether you’re searching for your dream home, exploring land options, or looking for commercial properties, my Real Estate Services have you covered.
Contact me today for all your real estate needs in Princeton, Texas! Call/text 214-940-8149

A Comprehensive Analysis of Single-Family Residential Housing Market in Princeton, TX: 2003 to Present
2010-2020
Princeton, TX Real Estate Market Report 2010: Analysis and Trends
Princeton, TX Real Estate Market Report 2011: Analysis and Trends
Princeton, TX Real Estate Market Report 2012: Analysis and Trends
Princeton, TX Real Estate Market Report 2013: Analysis and Trends
Princeton, TX Real Estate Market Report 2014: Analysis and Trends
Princeton, TX Real Estate Market Report 2015: Analysis and Trends
Princeton, TX Real Estate Market Report 2016: Analysis and Trends
Princeton, TX Real Estate Market Report 2017: Analysis and Trends
Princeton, TX Real Estate Market Report 2018: Analysis and Trends
Princeton, TX Real Estate Market Report 2019: Analysis and Trends
Princeton, TX Real Estate Market Report 2020: Analysis and Trends
2021-Present
Princeton, TX Real Estate Market Report 2021: Analysis and Trends
Princeton, TX Real Estate Market Report 2022: Analysis and Trends
Princeton, TX Real Estate Market Report 2023: Analysis and Trends
Princeton, TX Real Estate Market Report 2024: Analysis and Trends
This market analysis is intended solely for educational purposes. This market analysis is based on data sourced from NTREIS, Inc. This analysis is exclusively focused on single-family homes and does not account for other property types. The total number of real estate transactions within the specified period and location may vary. This market analysis does not account for all new construction home sales. If you need detailed information about recorded property sales or other public records, please contact the appropriate city or county office.