
The 2014 real estate market in Blue Ridge, TX experienced a dynamic rebound from the prior year, marked by rising property values, improved market efficiency, and a return to luxury sales. A total of 22 homes were sold, showcasing the city’s flexibility in catering to diverse home-buyer needs. With stronger pricing trends, faster transactions, and an increase in property quality, Blue Ridge’s market solidified itself as a prime spot for both affordability and high-end investments.
Key Takeaways and Trends from Blue Ridge’s 2014 Real Estate Market
Pricing Range: With highs of $425,000 and lows of $44,000, the market in 2014 showed resilience and reopened doors to luxury sales while maintaining affordability in the entry-level segment. The sharp rise in average and median prices captured the market’s upward momentum.
Market Efficiency: Faster turnovers, a shorter average DOM, and improved closing-to-list price ratios signal a seller-friendly environment with quick buyer activity.
Unique Outliers: The reintroduction of ultra-large properties, expansive acreage, and four-bathroom homes shows growing activity in the premium housing segment.
Total Homes Closed
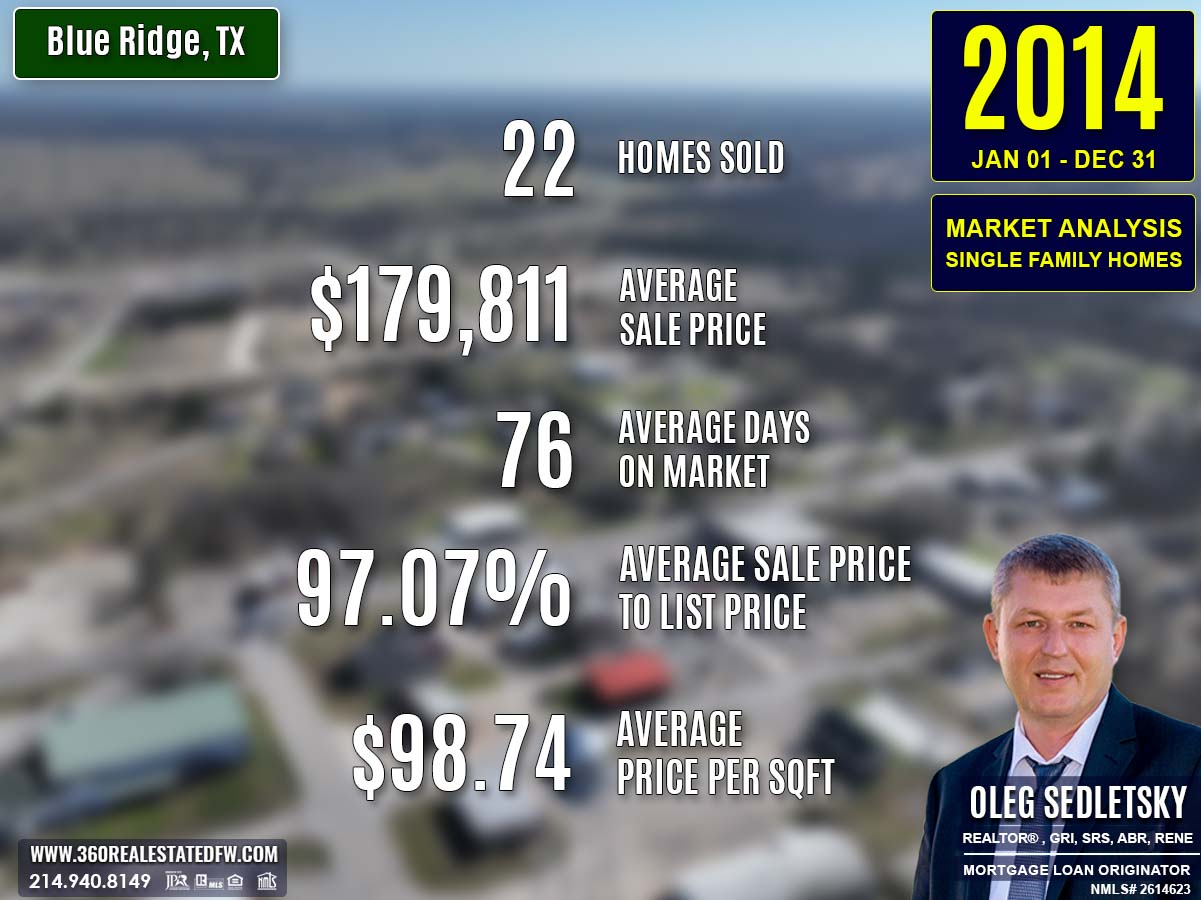
The year saw 22 single-family residential homes closed, an uptick from the 21 in 2013. This slight increase reflects steady demand and growing interest from a wide pool of buyers, especially as the market diversified its offerings.
Property Pricing Insights
The 2014 market saw a significant jump in property values, spanning a broad range to meet the needs of different buyer profiles:
- Minimum Price: $44,000, a substantial increase from 2013’s $25,500, indicating better-valued entry-level homes.
- Maximum Price: $425,000, a marked rise from $260,000, reflecting the revitalization of luxury sales.
- Average Price: $179,811, a major improvement from $120,657, showcasing substantial growth in overall property values.
- Median Price: $148,500, an increase from $102,000, demonstrating sustained demand in the mid-market range.
The broad price spectrum underscored opportunities for first-time homebuyers as well as high-end investors.
Property Size and Features
Bedrooms & Bathrooms
The variety of homes sold in 2014 catered to families and individuals alike:
- Bedrooms: Homes included 2 to 4 bedrooms, with an average of 3 bedrooms.
- Bathrooms: Properties offered 1 to 4 baths, highlighting homes equipped with modern amenities.
Square Footage
Homes offered functional living spaces across different size ranges:
- Minimum Size: 1,025 sq. ft., a notable expansion from 792 sq. ft. in 2013.
- Maximum Size: 3,312 sq. ft., a significant increase from 2,429 sq. ft., pointing to the return of larger, luxury homes.
- Average Size: 1,722 sq. ft., up from 1,684 sq. ft., catering to growing family needs.
- Median Size: 1,643 sq. ft., relatively stable compared to 1,741 sq. ft. the previous year.
Lot Sizes
Lot sizes were more spacious:
- Minimum Lot Size: 0.240 acres, higher than 2013’s 0.070 acres, removing ultra-small options.
- Maximum Lot Size: 28.000 acres, up from 20.000 acres, offering larger plots for premium properties.
- Average Lot Size: 6.044 acres, nearly doubling from 3.559 acres.
Market Dynamics
The renewed energy in Blue Ridge’s market brought noticeable improvements in its dynamics:
-
Days on Market (DOM):
- Minimum: 4 days, faster than 2013’s 7 days.
- Maximum: 330 days, lengthening slightly from 289 days, driven by slower transactions for high-end listings.
- Average: 76 days, a sharp improvement from 103 days, reflecting better efficiency.
-
ClsPr/LstPr Ratio (Close Price to List Price): Increased to 97.07%, up from 95.67%, reflecting precise pricing and confident negotiation.
-
ClsPr/OLP Ratio (Close Price to Original Listing Price): Surged to 98.33%, from 90.65%, indicating fewer price reductions.
-
Price Per Square Foot (Pr$/SqFt): Climbed to $98.74, a significant jump from $69.12, underscoring rising market valuations.
Insights into the Most Expensive Blue Ridge, TX Property Sold in 2014
The year’s most expensive property captured the attention of luxury buyers, combining space, modern amenities, and attractive location.
Highlights:
- Price: $425,000
- Bedrooms: 4
- Bathrooms: 4 (3 full, 1 half)
- Square Footage: 3,312 sq. ft.
- Price Per Square Foot: $128.32
- Lot Size: 15.000 acres
- Days on Market (DOM): 82 days
- ClsPr/LstPr Ratio: 96.61%
- ClsPr/OLP Ratio: 94.87%
- Year Built: 2002
Economic context
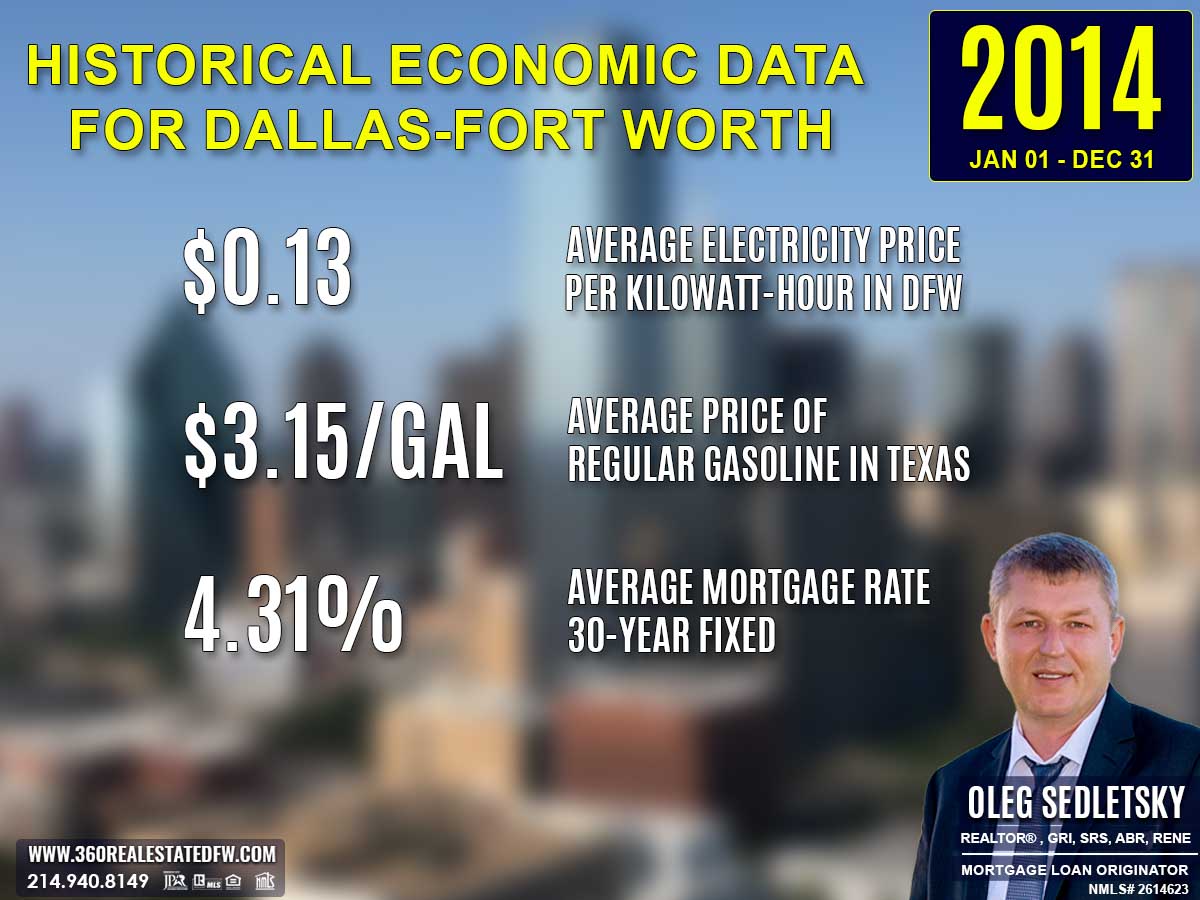
Average Electricity Costs in Dallas-Fort Worth in 2014
Electricity costs rose slightly to $0.13 per kilowatt hour, emphasizing the increased value of energy-efficient homes in the market.
Texas Average Gas Prices in 2014
Homeowners benefited from moderate gas prices averaging $3.15 per gallon, making suburban and rural properties with longer commutes more appealing.
Average 30-Year Fixed Mortgage Rate in 2014
Mortgage rates increased slightly to 4.31%, yet remained attractive for homebuyers and investors.
Curious about today’s mortgage rates and the home you can comfortably afford?
Submit a no-obligation mortgage application today and get pre-approved to determine your budget and take the first step toward homeownership with confidence.
Summary of Differences Between 2013 and 2014 Real Estate Data for Blue Ridge, TX
The real estate market in Blue Ridge, TX in 2014 displayed significant growth and increased efficiency compared to 2013. Below are the key differences:
Property Pricing Insights
- Minimum Price: Increased to $44,000 in 2014 (from $25,500 in 2013), indicating higher value for entry-level homes.
- Maximum Price: Jumped to $425,000 (from $260,000), reflecting renewed activity in the luxury housing market.
- Average Price: Surged to $179,811 (from $120,657), showing overall market growth and a shift toward higher-priced offerings.
- Median Price: Climbed to $148,500 (from $102,000), illustrating stronger mid-market home sales.
Property Features
-
Bedrooms:
- Minimum Bedrooms: Dropped to 2 in 2014 (from 3 in 2013), offering affordability and options for smaller households.
- Maximum Bedrooms: Remained stable at 4 bedrooms.
-
Bathrooms: The maximum number of bathrooms increased to 4 baths in 2014 (from 3 baths in 2013), demonstrating improved diversity of amenities.
-
Square Footage:
- Minimum Size: Rose significantly to 1,025 sq. ft. (from 792 sq. ft.), ensuring even entry-level homes offered better space.
- Maximum Size: Surged to 3,312 sq. ft. (from 2,429 sq. ft.), reflecting luxury home growth.
- Average Size: Saw a modest increase to 1,722 sq. ft. (from 1,684 sq. ft.), catering to larger family needs.
- Median Size: Adjusted slightly to 1,643 sq. ft. (from 1,741 sq. ft.), maintaining consistency in mid-market offerings.
Lot Size Area
- Minimum Lot Size: Increased to 0.240 acres in 2014 (from 0.070 acres in 2013), eliminating ultra-small lot options.
- Maximum Lot Size: Swelled to 28.000 acres (from 20.000 acres), indicating stronger availability of larger plots.
- Average Lot Size: Jumped to 6.044 acres (from 3.559 acres), appealing to buyers seeking more expansive properties.
Market Dynamics
-
Days on Market (DOM):
- Minimum DOM: Dropped to 4 days in 2014 (from 7 days in 2013), showcasing an even faster turnaround for attractive listings.
- Maximum DOM: Increased to 330 days (from 289 days), emphasizing the slower sale of high-end properties.
- Average DOM: Shortened dramatically to 76 days (from 103 days), reflecting improved market efficiency.
-
ClsPr/LstPr Ratio (Close Price to List Price): Improved to 97.07% (from 95.67%), highlighting accurate seller pricing and strong buyer demand.
-
ClsPr/OLP Ratio (Close Price to Original Listing Price): Jumped to 98.33% (from 90.65%), suggesting fewer price reductions and strong market confidence.
-
Price Per Square Foot (Pr$/SqFt): Increased significantly to $98.74 (from $69.12), illustrating a notable rise in property valuation.
Year Built
- Oldest Property: Became slightly newer, with oldest properties dating back to 1950 (compared to 1935 in 2013).
- Newest Property: Advanced to 2007 from 2006, showing ongoing additions to inventory.
- Average Year Built: Upgraded to 1991 (from 1983 in 2013), indicating higher-quality properties.
- Median Year Built: Elevated to 1998 (from 1988), reflecting a shift toward more modern homes.
Notable Market Shifts
- Revived Luxury Market: There was a sharp increase in maximum prices, property sizes, and bathroom counts, signifying a resurgence in demand for high-end luxury homes.
- Improved Market Efficiency: Faster average DOM and higher ClsPr/LstPr and ClsPr/OLP ratios highlighted a seller-friendly environment with strong buyer competition.
- Higher Values Per Square Foot: The steep increase in price per square foot underscored growing property valuations and demand for better-quality homes.
Overall, 2014 cemented Blue Ridge, TX’s real estate market as a thriving and diversified landscape, catering to both affordable and luxury homebuyers.
Summary of Real Estate Market Analysis for Blue Ridge, TX in 2014
The 2014 real estate market in Blue Ridge, TX experienced a substantial upswing, with notable growth across pricing, property features, and market efficiency. A total of 22 homes were sold, signaling steady demand and attracting homebuyers across a wide range of budgets. Rising property values reflected increased investor confidence and a return to luxury home offerings, while affordability remained accessible for first-time home-buyers. Market dynamics showcased faster sales timelines and improved pricing accuracy, creating opportunities for both buyers and sellers to achieve their goals efficiently. With economic factors such as manageable mortgage rates and declining gas prices, Blue Ridge, TX‘s real estate market demonstrated resilience and versatility, setting the stage for a promising future of balanced growth and opportunity.
Why Statistics Data is Important
Understanding past market data is essential for making informed decisions in today’s real estate landscape. Historical statistics provide a foundational perspective on trends, aiding in fair pricing and negotiation.
Unlock Exceptional Service!
Assistance with all your real estate needs in the Dallas-Fort Worth area is just a click or call away. Reach out at 214-940-8149 or connect through the links below.

Oleg Sedletsky REALTOR® in Blue Ridge, Texas. Call/Text 214.940.8149
Greetings! I’m Oleg Sedletsky, and I’m excited to introduce myself as your go-to full-time licensed Texas REALTOR® and Mortgage Loan Originator.
I proudly represent JPAR® – Real Estate Brokerage as a REALTOR® and Utopia Mortgage LLC as a Mortgage Loan Originator! My designations and certifications reflect my dedication to helping you achieve your real estate goals in Blue Ridge, TX and other locations in the vibrant Dallas-Fort Worth area!
My commitment to ongoing professional development means I’m always enhancing my skills to serve you better. You can count on me as your trusted expert throughout your real estate journey. Plus, I’m fluent in English, Ukrainian, and Russian and ready to assist you every step of the way!
It’s All About You and Your Real Estate Dreams!
My mission is to serve you! With my knowledge and expertise, I’m here to help you achieve all your real estate goals and turn your dreams into reality!
I’m passionate about helping buyers and sellers navigate the exciting real estate landscape in Blue Ridge, Texas! Whether you’re searching for your dream home, exploring land options, or looking for commercial properties, my Real Estate Services have you covered.
Contact me today for all your real estate needs in Blue Ridge, Texas! Call/text 214-940-8149

Discover Yearly Real Estate Market Trends for Blue Ridge, TX
2003-2010
Blue Ridge, TX Real Estate Market in 2003
Blue Ridge, TX Real Estate Market in 2004
Blue Ridge, TX Real Estate Market in 2005
Blue Ridge, TX Real Estate Market in 2006
Blue Ridge, TX Real Estate Market in 2007
Blue Ridge, TX Real Estate Market in 2008
2011-2020
Blue Ridge, TX Real Estate Market in 2011
Blue Ridge, TX Real Estate Market in 2012
Blue Ridge, TX Real Estate Market in 2013
Blue Ridge, TX Real Estate Market in 2014
Blue Ridge, TX Real Estate Market in 2015
Blue Ridge, TX Real Estate Market in 2016
Blue Ridge, TX Real Estate Market in 2017
Blue Ridge, TX Real Estate Market in 2018
This market analysis is intended solely for educational purposes. This market analysis is based on data sourced from NTREIS, Inc. This analysis is exclusively focused on single-family homes and does not account for other property types. The total number of real estate transactions within the specified period and location may vary. Data accuracy cannot be guaranteed due to potential input errors made by NTREIS users. This market analysis does not account for all new construction home sales. If you need detailed information about recorded property sales or other public records, please contact the appropriate city or county office.