
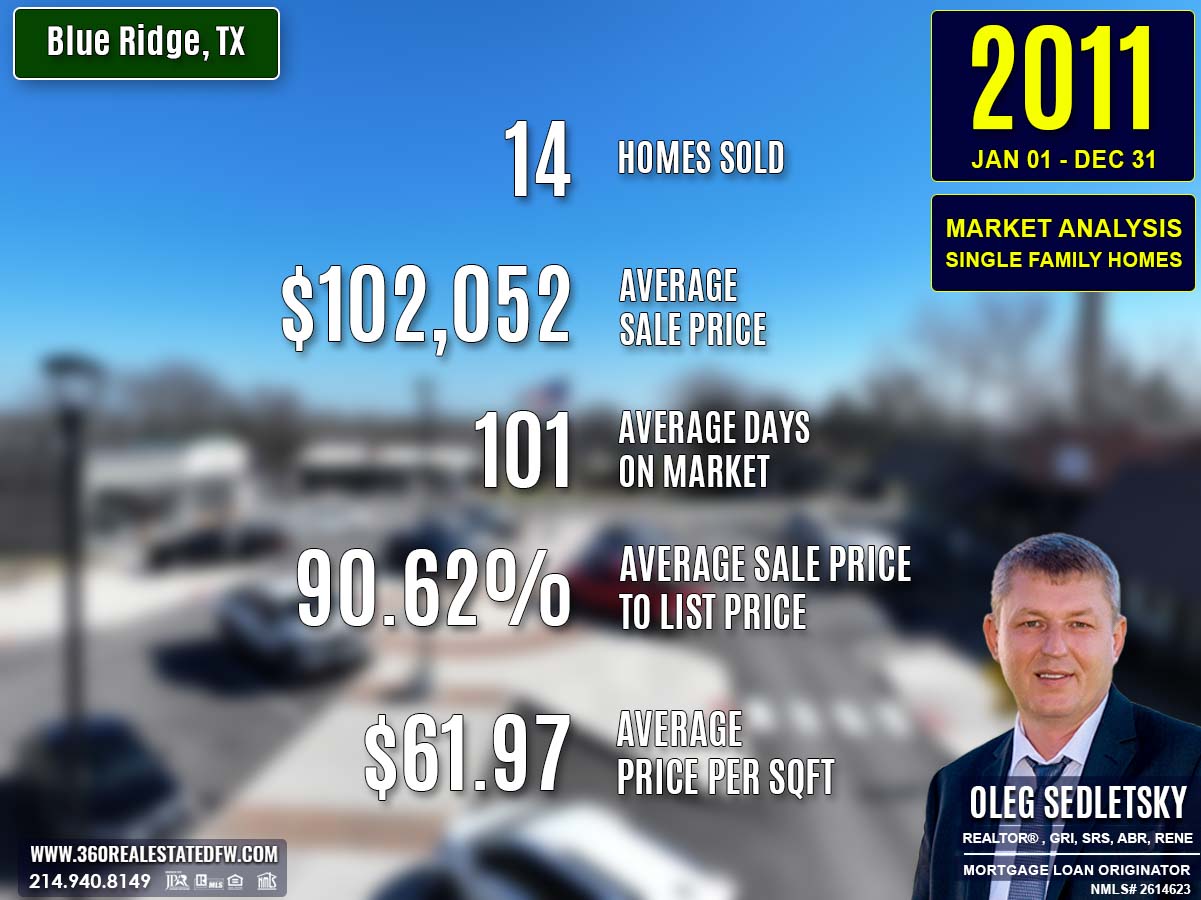
The 2011 real estate market in Blue Ridge, TX showed significant changes, characterized by increased pricing, quicker sales, and an emphasis on mid-sized and larger properties. With 14 closed transactions, this year reflected a drop in sales volume but demonstrated healthier valuations and improved market dynamics. Buyers and sellers adjusted to the evolving trends, navigating an efficient market with a more balanced pricing strategy.
Key Takeaways and Trends from Blue Ridge’s 2011 Real Estate Market
Pricing Range: The market refined its focus, with the minimum price increasing significantly to $26,000 while the maximum price adjusted slightly to $300,000. The rise in both median and average prices reflected improving evaluations and higher mid-market engagement.
Market Efficiency: The faster minimum DOM of 2 days and reduced maximum DOM showcased a more vibrant and competitive marketplace. Sellers saw improved buyer demand, especially for well-priced homes, and managed minor improvements in sale-to-list price ratios.
Unique Outliers: The availability of larger lot sizes, reaching a maximum of 40.808 acres, gave buyers new opportunities to access expansive outdoor spaces. However, smaller luxury homes dominated the high end, with maximum square footage reduced from 4,179 sq. ft. in the previous year to 2,862 sq. ft., aligning more with buyer preferences for value-based family homes.
Total Homes Closed
2011 saw 14 homes closed, a reduction from the 18 transactions in 2010. While the volume dipped, the market became more efficient, reflecting heightened competition for desirable properties.
Property Pricing Insights
The pricing dynamics in 2011 highlighted recovery in property values alongside affordability:
- Minimum Price: $26,000 (a significant increase from $5,100 in 2010, removing ultra-low-budget homes).
- Maximum Price: $300,000 (slightly below 2010’s high of $322,000, showing a more focused demand in the luxury segment).
- Average Price: $102,052 (up from $94,495, signaling a healthier market).
- Median Price: $78,650 (an improvement from $72,500, showcasing steady mid-market growth).
The rise in average and median prices indicates a re-calibrated market favoring balanced pricing over extreme affordability or luxury.
Property Size and Features
The 2011 market offered a more diverse range of property sizes and features with an emphasis on practicality and larger lot sizes:
- Bedrooms: Properties had 2 to 4 bedrooms, maintaining an average of 3 bedrooms.
- Bathrooms: Homes came with 1 to 3 bathrooms, maintaining an average of 2 bathrooms to suit families.
- Square Footage:
- Minimum Size: 866 sq. ft. (up from 744 sq. ft., offering more functional entry-level properties).
- Maximum Size: 2,862 sq. ft. (a reduction from the larger homes of 2010, which maxed out at 4,179 sq. ft.).
- Average Size: 1,749 sq. ft., showing growth from 2010’s average size of 1,610 sq. ft., and catering to buyers seeking more spacious homes.
- Median Size: 1,720 sq. ft., a step up from last year’s 1,420 sq. ft.
The market reflected a balance between mid-sized affordability and larger properties for families needing additional space.
Market Dynamics
2011 was a year of significant improvement in market efficiency and pricing consistency, as reflected in metrics like DOM and valuation trends:
- Days on Market (DOM):
- Minimum DOM: 2 days (a dramatic improvement from 6 days in 2010).
- Maximum DOM: 282 days (a sharp drop from 495 days, revealing quicker sales even at the higher end).
- Average DOM: Decreased to 101 days (from 135 days), showcasing a faster average market turnover.
- ClsPr/LstPr Ratio: Improved to 90.62%, suggesting stable seller-to-buyer pricing negotiations.
- ClsPr/OLP Ratio: Enjoyed a slight uptick to 84.81%, reflecting a reduction in listing price reductions.
- Price Per SqFt (Pr$/SqFt): Increased to $61.97, emphasizing healthier valuations and buyer interest in homes with better amenities.
The improved metrics underscored a more balanced and responsive market, with sellers achieving quicker deals and buyers finding quality homes across price ranges.
Insights into the Most Expensive Blue Ridge, TX Property Sold in 2011
The standout luxurious property of 2011 resumed the market’s refined appeal for high-quality spaces. Selling for $300,000, this charming home highlighted expansive living and modern amenities.
Key metrics include:
- Price: $300,000
- Square footage: 2,372 sq. ft.
- Price per sq. ft.: $126.48
- Bedrooms: 4
- Bathrooms: 3 full baths
- Lot size: 37.180 acres
- Days on Market (DOM): 147 days
- ClsPr/LstPr and ClsPr/OLP: 92.31%
- Year Built: 1972
This property’s combination of acreage, spacious layout, and modern features added to its high-end appeal, drawing buyer interest in a relatively short sales timeline.
Economic context
The economic environment in Blue Ridge, TX during 2011 exhibited notable shifts that influenced the local real estate market.
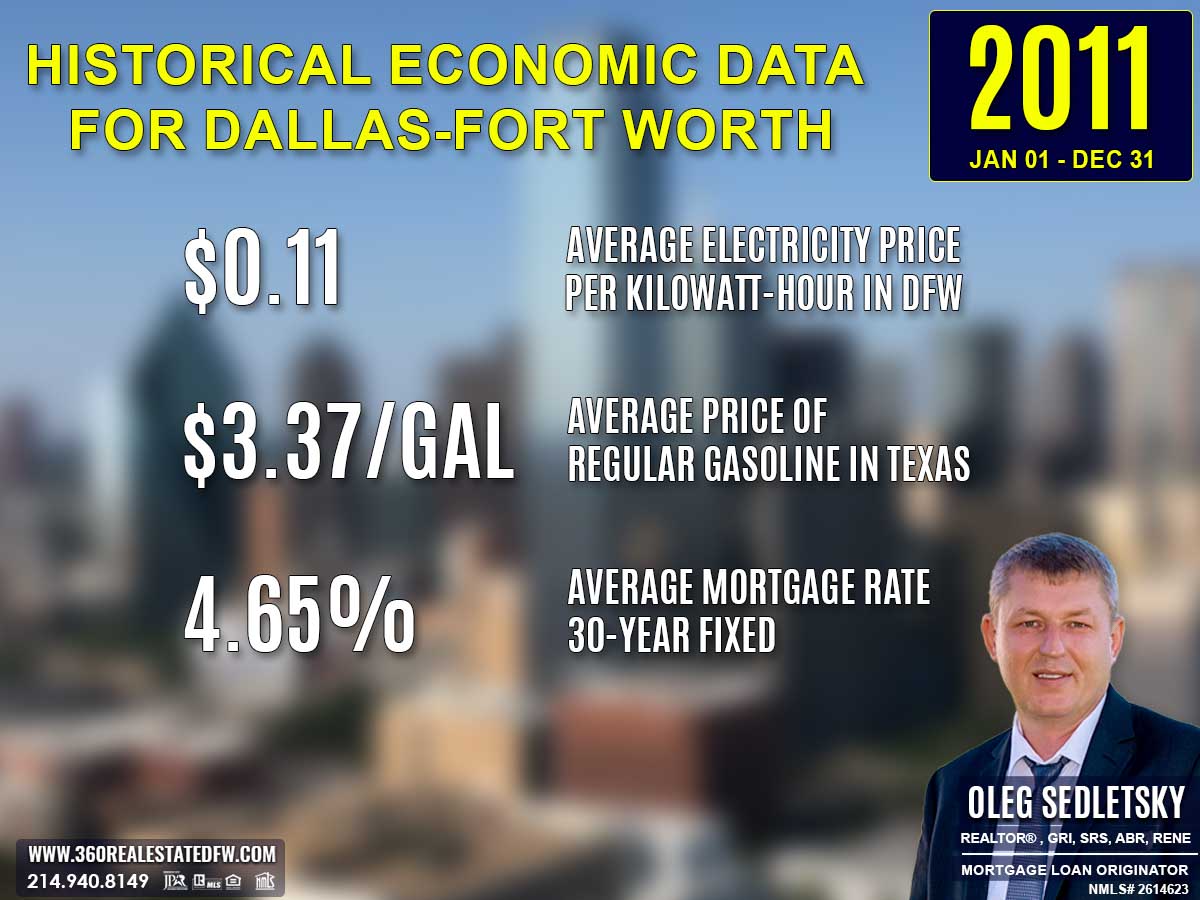
Average Electricity Costs in Dallas-Fort Worth in 2011
The average electricity price for 2011 decreased to $0.11 per kilowatt hour, offering homeowners reduced utility costs. This drop encouraged buyers to optimize living expenses and invest in energy-efficient properties.
Texas Average Gas Prices in 2011
Gas prices climbed considerably to $3.37 per gallon. This rise impacted commuter costs, incentivizing buyers to explore suburban or efficient locations closer to work to cut travel-related expenses.
Average 30-Year Fixed Mortgage Rate in 2011
The average fixed mortgage rate dropped slightly to 4.65%, creating low borrowing costs and making homeownership attractive to new buyers. This decline in rates allowed potential buyers to lock in favorable monthly payments, making even larger or upgraded homes more accessible. For first-time home-buyers and investors alike, 2011 presented a unique opportunity to capitalize on low borrowing costs and secure long-term savings. Taking the first step toward homeownership by locking in mortgage rates was crucial
Curious about today’s mortgage rates and the home you can comfortably afford?
Submit a no-obligation mortgage application today and get pre-approved to determine your budget and take the first step toward homeownership with confidence.
Summary of Differences Between 2010 and 2011 Real Estate Data for Blue Ridge, TX
The 2011 real estate market in Blue Ridge, TX evolved significantly compared to 2010, reflecting healthier property valuations and faster sales cycles despite some contrasting dynamics.
Property Pricing Insights
- Minimum Current Price: Increased from $5,100 in 2010 to $26,000 in 2011, removing ultra-low-cost options from the market.
- Maximum Current Price: Slightly decreased from $322,000 to $300,000, signaling a tapering in luxury demand.
- Average Price: Rose from $94,495 to $102,052, marking improved property valuations.
- Median Price: Increased from $72,500 to $78,650, showcasing steady growth in mid-market pricing.
Property Features
-
Bedrooms:
- Minimum Bedrooms: Increased from 1 in 2010 to 2 in 2011, addressing the demand for larger homes.
- Maximum Bedrooms: Held steady at 4 bedrooms, providing balance for family buyers.
-
Bathrooms: The maximum number of bathrooms dropped from 5 in 2010 to 3 in 2011, reflecting fewer high-end properties.
-
Square Footage:
- Minimum Size: Increased from 744 sq. ft. in 2010 to 866 sq. ft. in 2011, indicating fewer compact entries into the market.
- Maximum Size: Dropped from 4,179 sq. ft. to 2,862 sq. ft., signaling reduced luxury inventory.
- Average Size: Rose from 1,610 sq. ft. to 1,749 sq. ft., reflecting an overall uptick in home size.
- Median Size: Increased from 1,420 sq. ft. to 1,720 sq. ft., solidifying the preference for mid-sized homes.
Lot Size Area
- Minimum Lot Size: Increased from 0.180 acres in 2010 to 0.254 acres in 2011, ensuring slightly larger yard areas for buyers.
- Maximum Lot Size: Spiked from 7.776 acres to an impressive 40.808 acres, demonstrating greater availability of expansive lots.
- Average Lot Size: Jumped from 1.961 acres to 9.087 acres, reinforcing the appeal of properties with more land.
Market Dynamics
-
Days on Market (DOM):
- Minimum DOM: Improved from 6 days in 2010 to an exceptionally fast 2 days in 2011, signaling heightened demand for desirable listings.
- Maximum DOM: Decreased notably from 495 days to 282 days, reflecting greater market efficiency.
- Average DOM: Declined from 135 days to 101 days, indicating quicker turnover on average.
-
ClsPr/LstPr (Close Price to List Price Ratio): Slightly improved from 90.49% in 2010 to 90.62%, reflecting stable negotiation margins for sellers.
-
ClsPr/OLP (Close Price to Original Listing Price Ratio): Improved marginally from 84.59% to 84.81%, highlighting reduced price reductions to close deals.
-
Price Per SqFt (Pr$/SqFt): Increased from $54.58 to $61.97, representing better property valuations per square foot.
Year Built
- Oldest Property: Expanded inventory diversity, with the oldest property dating back to 1910 in 2011 compared to 1953 in 2010.
- Newest Property: Held steady with the most recent homes built in 2005 in both years.
- Average Year Built: Declined from 1988 in 2010 to 1976 in 2011, indicating a tilt toward selling older homes.
- Median Year Built: Dropped from 1987 to 1981, continuing the trend of older inventory dominating sales.
Key Observations
- More Efficient Market: Faster sales and reduced maximum DOM indicate better alignment between buyer demand and available inventory.
- Improved Prices: Growth in average property size, median pricing, and price per square foot represent healthier valuations.
- Varied Lot Sizes: The wide range in lot sizes brought diversity, offering buyers options for larger plots.
- Older Homes Dominate: A shift toward older properties reflects changing buyer priorities, possibly to capitalize on affordable renovation opportunities.
The 2011 market showcased modest improvements in value and efficiency, signaling cautious optimism amidst ongoing economic adjustments.
Summary of Real Estate Market Analysis for Blue Ridge, TX in 2011
The 2011 real estate market in Blue Ridge, TX showed marked improvements in valuations, sales dynamics, and inventory diversity. While the total number of transactions dropped compared to 2010, the market demonstrated increased efficiency with faster sales and solid pricing trends.
Home-Buyers benefited from moderately priced homes and expanded options for spacious lots while facing higher commuting costs due to rising gas prices. Home-Sellers experienced stronger closing ratios with less need for significant price reductions. The year highlighted a balanced housing market, appealing to both value-driven and quality-seeking buyers. These trends signaled cautious optimism and laid a solid foundation for ongoing recovery and growth in Blue Ridge’s real estate sector.
Why Statistics Data is Important
Understanding past market data is essential for making informed decisions in today’s real estate landscape. Historical statistics provide a foundational perspective on trends, aiding in fair pricing and negotiation.
Unlock Exceptional Service!
Assistance with all your real estate needs in the Dallas-Fort Worth area is just a click or call away. Reach out at 214-940-8149 or connect through the links below.

Oleg Sedletsky REALTOR® in Blue Ridge, Texas. Call/Text 214.940.8149
Greetings! I’m Oleg Sedletsky, and I’m excited to introduce myself as your go-to full-time licensed Texas REALTOR® and Mortgage Loan Originator.
I proudly represent JPAR® – Real Estate Brokerage as a REALTOR® and Utopia Mortgage LLC as a Mortgage Loan Originator! My designations and certifications reflect my dedication to helping you achieve your real estate goals in Blue Ridge, TX and other locations in the vibrant Dallas-Fort Worth area!
My commitment to ongoing professional development means I’m always enhancing my skills to serve you better. You can count on me as your trusted expert throughout your real estate journey. Plus, I’m fluent in English, Ukrainian, and Russian and ready to assist you every step of the way!
It’s All About You and Your Real Estate Dreams!
My mission is to serve you! With my knowledge and expertise, I’m here to help you achieve all your real estate goals and turn your dreams into reality!
I’m passionate about helping buyers and sellers navigate the exciting real estate landscape in Blue Ridge, Texas! Whether you’re searching for your dream home, exploring land options, or looking for commercial properties, my Real Estate Services have you covered.
Contact me today for all your real estate needs in Blue Ridge, Texas! Call/text 214-940-8149

Discover Yearly Real Estate Market Trends for Blue Ridge, TX
2003-2010
Blue Ridge, TX Real Estate Market in 2003
Blue Ridge, TX Real Estate Market in 2004
Blue Ridge, TX Real Estate Market in 2005
Blue Ridge, TX Real Estate Market in 2006
Blue Ridge, TX Real Estate Market in 2007
Blue Ridge, TX Real Estate Market in 2008
2011-2020
Blue Ridge, TX Real Estate Market in 2011
Blue Ridge, TX Real Estate Market in 2012
Blue Ridge, TX Real Estate Market in 2013
Blue Ridge, TX Real Estate Market in 2014
Blue Ridge, TX Real Estate Market in 2015
Blue Ridge, TX Real Estate Market in 2016
Blue Ridge, TX Real Estate Market in 2017
Blue Ridge, TX Real Estate Market in 2018
This market analysis is intended solely for educational purposes. This market analysis is based on data sourced from NTREIS, Inc. This analysis is exclusively focused on single-family homes and does not account for other property types. The total number of real estate transactions within the specified period and location may vary. Data accuracy cannot be guaranteed due to potential input errors made by NTREIS users. This market analysis does not account for all new construction home sales. If you need detailed information about recorded property sales or other public records, please contact the appropriate city or county office.